


Abstract
Granophyric blocks within late-Pleistocene pyroclastic flow ejecta from the Alid volcanic center, northeast Africa, are the rapidly crystallized, intrusive equivalent of pumice from the pyroclastic flow. Phenocryst compositions and geochemical characteristics of the pumice and granophyre are virtually identical. Silicate melt inclusions and other geochemical and geological constraints reveal those processes leading to development of the granophyric texture. Rhyolitic (A-type) magma with ∼2.6 wt % dissolved H2O and a temperature near 870°C was intruded to within 2–4 km of the surface, causing deformation and structural doming of shallow marine and subaerial strata. Eruptions of crystal-poor rhyolite from this shallow magma chamber caused degassing, which forced undercooling and consequent granophyric crystallization of some of the magma remaining in the intrusion. The most recent eruption from Alid excavated the crystallized granitic wall of the magma chamber, bringing the granophyric clasts to the surface.
Introduction
Granophyric intergrowths are among the most impressive and beautiful of rock textures. Commonly, they consist of fine-grained intergrowths of quartz and feldspar arranged in patterns that can vary from irregular to vermicular to cuneiform (Barker, 1970). Typically, the groundmass feldspars radiate off pre-existing feldspar phenocrysts, with which they are in optical continuity (Dunham, 1965). Some workers prefer the term ‘micrographic’ for highly regular, interlocking arrangements of quartz and feldspar, as in the coarser graphic granite (Fenn, 1986; Lentz & Fowler, 1992). Though Schloemer, (1964) has shown that some graphic textures can grow by replacement [see also Augustithis, (1973)], most workers agree that phenocryst-bearing granophyres typically form by rapid and simultaneous crystallization of quartz and feldspar from a melt (Smith, 1974). Such crystallization is generally believed to be due to pronounced undercooling of the silicate liquid (Vogt, 1930; Dunham, 1965); not necessarily at eutectic temperatures or compositions (Fenn, 1986; London et al., 1989; Lentz & Fowler, 1992).
Granophyric textures are common in epizonal granitic bodies, particularly those associated with volcanic rocks (Buddington, 1959; Dunham, 1965). On occasion, they erupt as comagmatic ejecta in pyroclastic deposits (e.g. Lipman et al., 1997). They are often found in A-type granites, such as those of continental-rift environments (Whalen et al., 1987; Coleman et al., 1992). In this paper, we describe cognate, granophyric blocks within pumice deposits erupted at the Alid volcanic center, Eritrea. By correlating these erupted blocks with related volcanic rocks and by using the geologic relationships available, we provide compelling evidence for the pressure, temperature and geologic conditions under which the granophyric groundmass formed.
Background Geology
Alid volcanic center and the Danakil Depression
The Alid volcanic center, Eritrea (Marini, 1938a, 1938b), is located along the axis of the Danakil Depression, the graben trace of a crustal spreading center that radiates NNW from a plate-tectonic triple junction within a complexly rifted and faulted basaltic lowland called the Afar Triangle (Fig. 1). The Danakil Depression is a subaerial segment of the spreading system that is opening to form the Red Sea. It lies near or below sea level for much of its extent and is surrounded by the Danakil Alps to the east and the Eritrean plateau or highland to the west, which rises to elevations of 2000–3000 m above sea level (masl). Both of these bordering regions are underlain primarily by Precambrian gneisses, granites and schists, locally covered by mid-Tertiary basalt. Much of the Afar lowland is covered with Pliocene and Quaternary lavas (CNR–CNRS, 1973). Erta Ale, one of the most active volcanoes in the world, lies about 100 km SE of Alid.
The Alid volcanic center is an elliptical structural dome formed during uplift caused by shallow intrusion of rhyolitic magma, some of which was erupted (Clynne et al., 1996a, 1996b). The major axis of Alid is 7 km, elongate ENE–WSW, perpendicular to the trend of the graben (Fig. 2). The minor axis is about 5 km long, parallel to the graben. Alid rises ∼700 m above a field of Quaternary basaltic lava that laps unconformably against the north and south flanks of the mountain.
The oldest rocks to crop out on Alid are Precambrian quartz–mica and kyanite schists found within a deep canyon, Sillaló, that drains the east side of the mountain. Overlying this basement rock is the ‘sedimentary sequence’, consisting of marine siltstone and sandstone, pillow basalt, subaerial basalt, anhydrite beds and fossiliferous limestone, all interpreted to be Pleistocene in age (Clynne et al., 1996a; Duffield et al., 1997). The ‘sedimentary sequence’ (ss) is found on all parts of the mountain, and dips radially away from its geographic center. Stratigraphically above the ‘sedimentary sequence’ is the ‘lava shell’ (ls), which consists of basalt and basaltic andesite lava flows, pyroclastic deposits, amphibole-bearing rhyolite domes, and intercalated eolian sands. The shell rocks form most of the slopes of the mountain, with dips locally as steep as 65°. Such steep dip slopes must have formed subsequent to emplacement of these fluid lava flows, as they are far too steep to be original (Clynne et al., 1996a, 1996b).
Structural doming caused considerable distension of the shell and sedimentary units, and effected landsliding and collapse of the central region of the mountain, resulting in a basin-like depression. Clinopyroxene-bearing rhyolite lavas, dated at 33.5±4.6 ka, were erupted subsequent to the initiation of structural doming (Duffield et al., 1997). Similar rhyolite was erupted as pyroclastic flows from the summit region and today forms blankets of tephra up to 15 m thick in the summit basin and the west flank of Alid (‘pf unit’ of Fig. 2). The final phase of this eruption, a lava dome, is dated at 23.5±1.9 ka [‘pxrhy’ of Duffield et al., 1997)]. All post-doming rhyolites have mineralogy (anorthoclase and Fe-rich clinopyroxene) and trace-element geochemistry typical of A-type granite systems found in similar non-arc geological settings (Bowden, 1974; Whalen et al., 1987; Eby, 1990; Coleman et al., 1992). Similar rhyolites and granites, which are related to earlier periods of Red Sea spreading, have been described in Saudi Arabia and Yemen by Coleman et al., (1992) and Chazot & Bertrand, (1995), respectively.
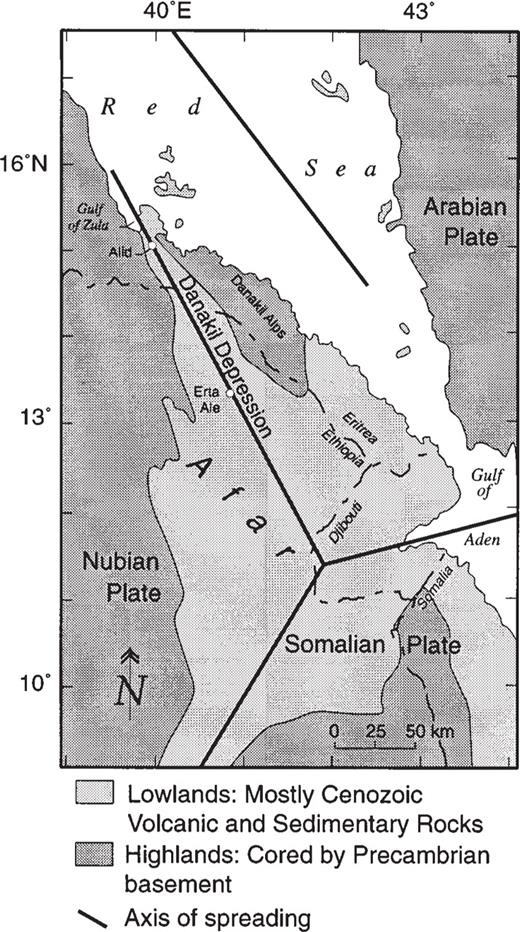
Simplified plate-tectonic map of the Afar Triangle region. Modified from Barberi & Varet, (1977).
![Generalized geologic map of Alid volcanic center. Because the map was traced from lines on air photographs, the scale is approximate and varies somewhat across the map [modified from Clynne et al., (1996a)].](https://oup.silverchair-cdn.com/oup/backfile/Content_public/Journal/petrology/38/12/10.1093/petroj/38.12.1707/2/m_petrology-38-1707-g002.jpeg?Expires=1716320350&Signature=g0LvDmWVTe96XZxO2vLV7RdHr0AUdhoObZpOImqEAOGSC9lvRDfOhufUYQ7XTg60DcD6917uz9qbfB2JkllVfm7QsT6s9Ad-K1cW4k-OU8YN-GQ0l--jOVE5cyrxE8i1tYjz2TaE-NqPrgvtTNuLuJIXQ-c9MQZ8XwdYUwJmQzrUfjSKRp1OgrF9LDFgtIOtb9E3Uv95z2lK~9z4Nj2B7FfcBg2mWi9chSkr7~3EnJJz-5imbRzSj~myG0knXkcAx5PTEbVuODaSFUSchdR0pXkaOnUSwJzxEVJNKZjMmox~RWeRyRWq0ttD-3NPxrG4mzW96SI5N85ZuaZk68aTlw__&Key-Pair-Id=APKAIE5G5CRDK6RD3PGA)
Generalized geologic map of Alid volcanic center. Because the map was traced from lines on air photographs, the scale is approximate and varies somewhat across the map [modified from Clynne et al., (1996a)].
We infer that a body of granitic magma intruded to a shallow level, caused structural doming, and erupted as lava flows and pyroclastic deposits. The lack of post-pyroclastic-flow, basaltic vents on Alid, even though such vents are common to the north and south, may signify that magma still resides beneath Alid and impedes the ascent of mafic magma (Clynne et al., 1996a, 1996b). Whether the magma is still partially molten or completely crystallized, it continues to release enough heat to drive a geothermal system, as fumaroles are found in the summit basin and on Alid's north flank (Clynne et al., 1996a, 1996b; Lowenstern et al., 1997).
Blocks within the pyroxene rhyolite tephra deposits
Lithic blocks are abundant throughout the thick pyroclastic flow deposits (‘pf unit’) in the summit basin and west flanks of Alid: they consist (in order of decreasing abundance) of amphibole rhyolite, lava-shell basalts, and Precambrian schists and granites. In the upper 1–2 m of the deposit, blocks of a fine-grained, clinopyroxene-bearing granite are markedly different in macroscopic texture from Precambrian granite clasts, which are angular, indurated and contain hydrous minerals. In contrast, the pyroxene granite clasts are friable, low density (∼2.45±0.07 g/cm3), rounded and reach up to 1 m in diameter. They were briefly described by Beyth, (1994, 1996), who called them ‘microgranite’. Clynne et al., (1996a, 1996b) used the term ‘pyroxene granite’, and below, we use the term ‘granophyric blocks’. The blocks, as discussed below, are interpreted to be comagmatic with the pumice, and represent part of the pyroxene rhyolite intrusion that caused deformation at Alid. Apparently, their granophyric textures formed during an early eruption from this shallow intrusion. They were subsequently disaggregated from the magma chamber wall and erupted during the most recent pyroclastic episode, at ∼23.5 ka. This study presents chemical and petrographic data from a single large (∼1 m diameter) granophyric block, inferred to be representative of the many others found in the pyroclastic flow ejecta.
Petrography
Granophyric textures
Intergrowths of quartz and alkali feldspar form the groundmass of the granophyric block (Fig. 3a and b), and make up 50–70 vol. % of the rock. The elongate alkali feldspar crystals, or stringers, nucleate directly from the pre-existing feldspar phenocrysts [Fig. 3c and d; Texture e, ‘radiating fringe’, in figs 2–7 of Smith, (1974)]. Often, the stringers coarsen as they emanate from the seed crystal and form fan-like splays. Groups of stringers that emanate from the same seed phenocryst are always in optical continuity with each other, as well as the seed. In effect, the feldspar groundmass is an extension of the original phenocryst, and grew by cellular, quasi-skeletal growth rather than planar crystallization (Fenn, 1986).
The groundmass quartz never connects directly to either feldspar or quartz phenocrysts (Fig 3e). Instead, the quartz apparently nucleated on the feldspar stringers themselves. Growth of the feldspar may have induced local supersaturation with quartz, which then fills in the interstices left between the growing feldspars (Lentz & Fowler, 1992). Though the quartz is discontinuous in plan view, filling in the space between the stringers of feldspar, it shows optical continuity over large regions (up to 1 mm) demonstrating that the quartz is continuous in three dimensions as relatively large individual crystals. Many areas of the groundmass have micrographic texture, where the granophyre is extremely uniform in pattern, sometimes cuneiform, relatively isotropic in plan view and contains euhedral rods and triangles of quartz (Fig. 3b). These textures are intermediate between the coarse-grained graphic intergrowths grown from hydrous pegmatitic melts (London, 1996) and the crude, poorly crystallized granophyres of intracaldera welded tuffs, which are highly undercooled and degassed.
Thick-sections, prepared as slabs of 100–200 µm thickness, reveal details that are missed in 30 µm thin sections. Silicate melt inclusions are typically 10–20% crystalline and occur in both feldspar and quartz phenocrysts in the granophyric block. Small, 2–20 µm, partly crystallized melt inclusions also are present within the granophyric stringers. In addition, small faceted, vapor-rich fluid inclusions (predominantly a vapor bubble plus 10–40% liquid) are located in both the phenocryst phases and groundmass stringers in the granophyric blocks (Fig. 3f). These fluid inclusions appear to represent primary magmatic vapors, trapped during original crystal growth. Individual vapor-rich inclusions are common at the tips of feldspar stringers in the groundmass (Fig. 3g), indicating that crystallization was accompanied by vapor exsolution (second boiling). Void space within the granophyre is commonly seen along grain boundaries, which may have served as channelways for escaping vapor. Vapor-rich inclusions were not observed in phenocrysts from the volcanic ‘pf unit’.
Mineral compositions
All rhyolites erupted within the last 33.5 kyr are clinopyroxene bearing and contain alkali feldspar, magnetite, zircon, apatite and pyrrhotite phenocrysts. Rhyolitic pumice lumps of the ‘pf unit’ also contain minor quartz. Some pyroxene rhyolites on Alid's east flank (frhy2 and -3 of Fig. 2) contain minor fayalite, as well as pyroxene. Hydrous minerals are absent in all extrusive rhyolites, except in the much older (∼210 ka) amphibole rhyolites.
The compositions of feldspar phenocrysts from the ‘pf unit’ pumice lumps range from K-poor anorthoclase (An10Ab73Or17) to Ca-poor sodic sanidine (An2Ab60Or38) (Table 1). Maps of feldspar crystals, made by scanning the phenocrysts beneath the beam of an electron microprobe, demonstrate that many crystals contain a core of K-poor anorthoclase that contains rounded edges and numerous embayments (Fig. 4). Subsequent growth of a rim of sodic sanidine resulted in euhedral phenocrysts with K-rich rims (Figs 4 and 5). BaO concentrations are high (0.4–0.6 wt %) in the anorthoclase cores, and decline to about 0.15 wt % or less in the potassic rims (Fig. 6). No reverse zoning of feldspar was observed for either CaO or BaO, possibly signifying that the resorption event that caused rounding of the feldspar cores was not caused by mixing of the melt with a less evolved, more Ca- or Ba-rich end-member. Instead, the resorption may have been caused by simple heating of the rhyolite by mafic magma, without chemical mixing.
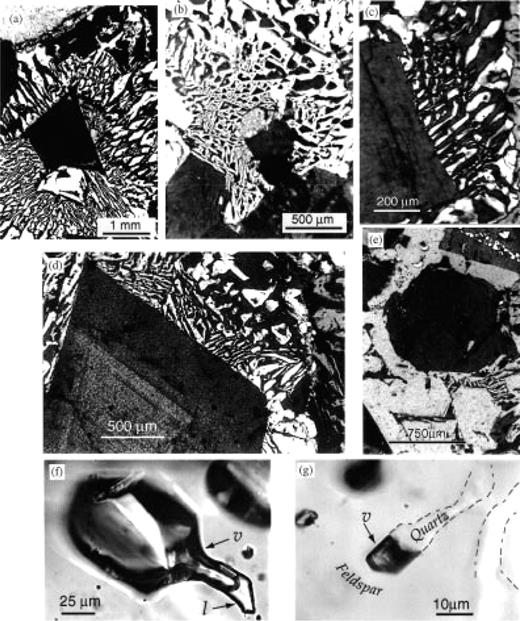
Photomicrographs of areas within granophyric block found as a lithic in the ‘pf unit’ at the Alid volcanic center. Figure parts (a)–(e) with crossed Nicols. (a) Micrographic groundmass surrounds feldspar phenocryst fragment. (b) Micrographic groundmass around clinopyroxene phenocryst. Quartz is white and feldspar is at extinction. (c, d) Radiating fringe of feldspar in groundmass is in optical continuity with phenocryst, from which it nucleated. (e) Quartz phenocryst is surrounded by feldspar groundmass. Quartz in groundmass does not appear to have nucleated directly on phenocryst, but is in optical continuity with it. (f) Primary vapor-rich fluid inclusion in phenocrystic quartz. Liquid (l) is seen at the bottom right, the rest being vapor (v). (g) Primary vapor-rich inclusion at the tip of a quartz stringer (outlined for clarity) in the granophyric groundmass.
As in the pumice, feldspar phenocrysts in the granophyre are zoned from K-poor anorthoclase to sodic sanidine (Table 1). Potassium-rich rims range up to An1Ab55Or44 and stringers of feldspar in the granophyric groundmass are even slightly more K enriched (up to An1Ab52Or47). Interestingly, the K/Na of the feldspar stringers (Or40–45) is similar to that of the glass matrix of the pumice. The K/Na ratio (by weight) lies between 1.03 and 1.20 for silicate melt inclusions and pumiceous matrix: stringers in the granophyre have similar ratios (Table 1).
Chemical and isotopic analyses of pyroxenes, alkali feldspars, biotite, glass, and whole rocks from granophyric block (gr) and rhyolitic pumice from the ‘pf unit’(pf), Alid volcanic center, Eritrea
| Pyroxene core | Pyroxene rim | Feldspar core | Feldspar rim | Feldspar | Biotite (gr) | |||
|---|---|---|---|---|---|---|---|---|
| (pf) (wt %) | (pf) (wt %) | (pf) (wt %) | (pf) (wt %) | grndmss (gr) | (wt %) | |||
| (wt %) | ||||||||
| SiO2 | 50.06 | 49.73 | SiO2 | 65.02 | 66.50 | 67.15 | SiO2 | 39.07 |
| Al2O3 | 0.84 | 0.32 | Al2O3 | 20.74 | 19.31 | 18.96 | Al2O3 | 9.65 |
| FeO | 16.38 | 22.49 | FeO | 0.25 | 0.16 | 0.15 | TiO2 | 1.56 |
| Fe2O3 | 2.10 | 1.30 | CaO | 2.05 | 0.50 | 0.13 | FeO | 25.32 |
| MgO | 8.61 | 5.76 | Na2O | 8.57 | 6.93 | 6.58 | MnO | 0.53 |
| MnO | 0.82 | 1.16 | K2O | 3.29 | 6.59 | 7.17 | MgO | 10.41 |
| TiO2 | 0.29 | 0.15 | BaO | 0.37 | 0.25 | 0.09 | CaO | 0.02 |
| Cr2O3 | 0.01 | 0.00 | SrO | 0.11 | <0.1 | <0.1 | Na2O | 0.64 |
| CaO | 20.30 | 18.85 | K2O | 9.70 | ||||
| Na2O | 0.53 | 0.43 | F | 4.61 | ||||
| Total | 99.94 | 100.19 | Total | 100.40 | 100.24 | 100.23 | Cl | 0.31 |
| Subtotal | 101.81 | |||||||
| quad % | 93.0 | 95.6 | mol % | −F,Cl | −2.01 | |||
| Wo (mol %) | 45.1 | 42.5 | An | 9.5 | 2.4 | 0.6 | Total | 99.80 |
| En (mol %) | 26.6 | 18.0 | Or | 18.3 | 37.6 | 41.5 | XPhl | 0.41 |
| Fs (mol %) | 28.4 | 39.5 | Ab | 72.2 | 60.0 | 57.9 | XSid | 0.00 |
| mg-no. | 48.4 | 31.3 | XAn | 0.59 |
| Whole rock | Whole rock | Av. Melt Inc. | Whole rock | Whole rock | Isotopic analyses | |||
|---|---|---|---|---|---|---|---|---|
| (pf) (wt %) | (gr) (wt %) | (pf) (wt %) | (pf) (ppm) | (gr) (ppm) | ||||
| SiO2 | 73.50 | 73.63 | 76.29 | Ba (XRF) | 529 | 516 | Pumice from pf | |
| Al2O3 | 13.12 | 13.20 | 11.93 | Rb (XRF) | 119 | 110 | 87Sr/86Sr | 0.70441 |
| Fe2O3* | 2.58 | 2.47 | 1.50 | Sr (XRF) | 47 | 41 | 206Pb/204Pb | 19.214 |
| MgO | 0.18 | 0.16 | 0.03 | Zr (XRF) | 408 | 413 | 207Pb/204Pb | 15.618 |
| CaO | 0.97 | 0.98 | 0.35 | Y (ICPMS) | 62 | 61 | 208Pb/204Pb | 38.879 |
| Na2O | 4.20 | 4.54 | 4.47 | Nb (XRF) | 126 | 128 | δ18O (‰) | 6.5±0.2 |
| K2O | 5.11 | 4.69 | 4.59 | Ga (XRF) | 19 | 23 | ||
| TiO2 | 0.23 | 0.23 | 0.12 | U (ICPMS) | 3.51 | 3.17 | Granophyric block | |
| P2O5 | 0.04 | 0.04 | n.d. | La (ICPMS) | 84.38 | 83.52 | 87Sr/86Sr | 0.70468 |
| MnO | 0.07 | 0.06 | n.d. | Ce (ICPMS) | 147.7 | 144.34 | 206Pb/204Pb | 19.213 |
| Cl | n.d. | n.d. | 0.38 | Nd (ICPMS) | 55.76 | 54.85 | 207Pb/204Pb | 15.616 |
| F | n.d. | n.d. | 0.33 | Eu (ICPMS) | 1.26 | 1.30 | 208Pb/204Pb | 38.871 |
| Total† | 96.53 | 98.94 | 97.20 | Yb (ICPMS) | 6.27 | 5.93 | δ18O (‰) | 6.6±0.2 |
For whole rocks, Fe calculated as ferric iron. For melt inclusions, Fe calculated as ferrous iron.
Whole-rock major-element analyses and melt inclusion average are recalculated to 100% normalized. Original total (non-normalized) listed in total row. Values for melt inclusions represent mean of 19 electron microprobe analyses. Whole rocks represent individual samples analyzed by X-ray fluorescence (XRF) (major-elements+some trace) and inductively coupled plasma mass spectrometry (ICPMS).
Mineral analyses by electron microprobe. Ternary components in pyroxene (and Fe2O3 concentration) according to methods of Papike et al. (1974). Except for pyroxene analyses, FeO concentrations assume all Fe as ferrous. Biotite end-member components calculated with code provided by F. Munoz (personal communication, 1988). Groundmass feldspar (gr) is from a micrographic intergrowth in the granophyric block. δ18O reported in units in per mil deviation relative to VSMOW. (See Appendix for details on all analytical techniques.) n.d. not determined.
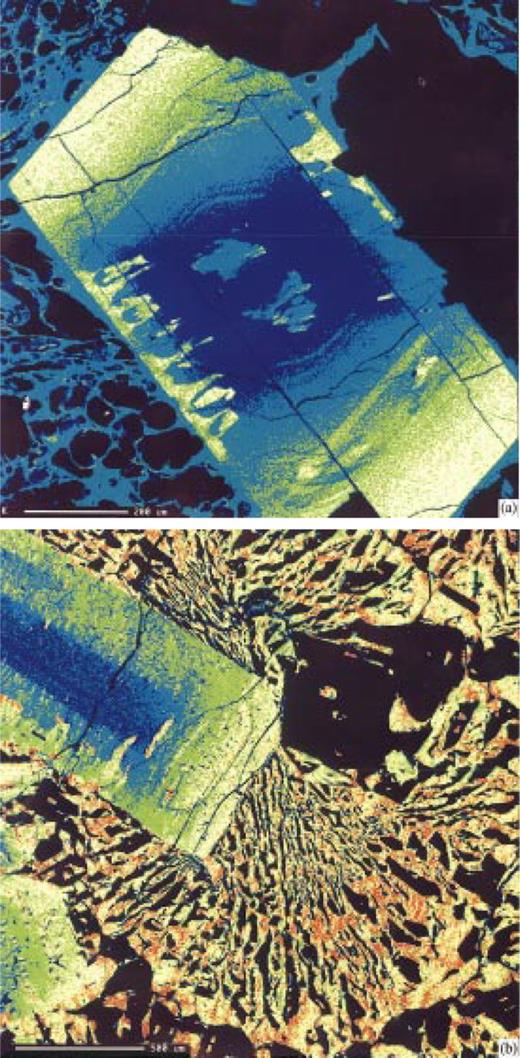
Maps of K distribution in alkali feldspars. Red represents highest concentrations, followed by yellow, green and blue. See Appendix for details. Scales as indicated in figure parts. (a) Feldspar in ‘pf unit’ pumice, surrounded by pumiceous glass. The feldspar core is a K-poor anorthoclase that has been resorbed. Embayments have been filled with more K-rich sodic sanidine. (b) Feldspar in granophyric block. Feldspar shows same general features as in (a). Feldspar stringers in granophyre are approximately the same composition as the K-rich rim of sodic sanidine.
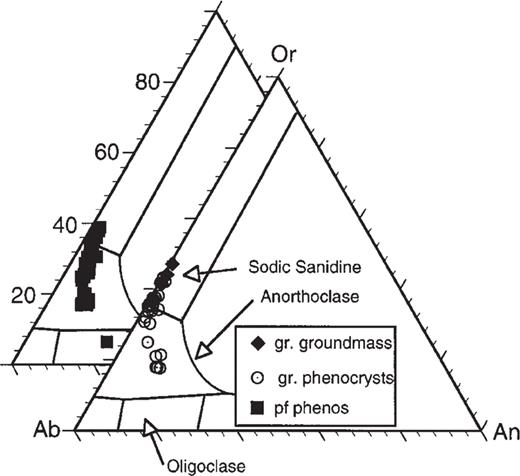
Ternary diagram showing mol % of feldspar components (Or, Orthoclase; An, Anorthite; Ab, Albite) in feldspars from granophyric block (gr) and pumice from ‘pf unit’ (see Table 1 and Appendix). Feldspars in both rock types are similar, with cores of K-poor anorthoclase and rims of sodic sanidine. Stringers of feldspar in the granophyric groundmass reach values of about Or50.
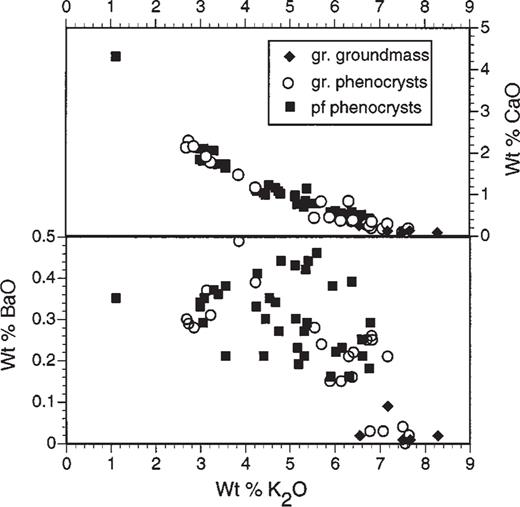
Wt % BaO and CaO vs K2O for feldspars from the ‘pf unit’ and granophyric block (gr), as determined by electron microprobe.
Pyroxenes in the ‘pf unit’ pumice lumps, as well as several other ‘frhy’ rhyolites from the west flank of Alid, range from ferrosalite to ferroaugite in composition (Table 1). Cores are typically close to Wo45En27Fs28, mantled by more Fe-rich pyroxene. Rims reach Wo42En18Fs40. Rhyolites on the east flank of Alid (‘frhy2’), which were erupted before the ‘pf unit’, contain more Fe-rich pyroxenes that reach near-end-member hedenbergite in composition. Pyroxene rims are slightly more Fe enriched in the granophyre than in the host pumice, reaching Wo45En10Fs45, though they are otherwise similar in both rock types.
Besides their groundmasses, the only obvious mineralogical differences between the granophyric blocks and the rhyolite pumice are the following: (1) the presence of minor amounts of fluorite and chevkinite at the margins of phenocrysts in the granophyre; (2) partial replacement of clinopyroxene in the granophyre by Fe-rich biotite (Annite59Phlogopite41Siderophyllite0), apparently before the crystallization of the groundmass; (3) minor amounts of clay and chlorite in cracks and small miarolitic cavities. The analyzed biotites (Table 1) are uniform in composition, not varying more than a few mol %, and are more Fe rich than biotites in the amphibole-bearing rhyolites (Annite31Phlogopite67Siderophyllite2) that were erupted at ∼210 ka, long before deformation of Alid. The annite-rich biotites are characteristic of micas found in A-type granites (Abdel-Rahman, 1994).
Trace-Element and Isotope Geochemistry
The granophyric block and the pumice from the pyroclastic flow are nearly identical in major-element, trace-element and isotopic compositions (Table 1). Nearly all analyzed trace elements are the same, within 5% relative, in the two rocks. Most of the other pyroxene rhyolites share these similarities in major-, trace-element and isotopic compositions with the ‘pf unit’ pumice and granophyric blocks, but have more restricted phenocryst compositions than those discussed above. The granophyric block appears to be the crystallized (closed-system) equivalent of the ‘pf unit’ pumice.
The two rocks are isotopically distinct from clasts of the Precambrian granite basement (e.g. 87Sr/86Sr=0.77545; 208Pb/204Pb=37.227; δ18O=8.9%°). Trace-element compositions of the basement granites (e.g. Rb=214 ppm; Ba=148 ppm; U=1.36 ppm) are also unlike the granophyric blocks. It is clear that the friable, granophyric blocks are distinct texturally, mineralogically, and chemically from the Precambrian basement lithic material that was ejected during eruption of the ‘pf unit’.
The Alid Magma Reservoir
The mineralogical and compositional similarities between the pumice and granophyric blocks demonstrate that these two rocks share a similar origin. We can, therefore, use the ‘pf unit’ pumice to infer characteristics of the magma chamber at the time of granophyre crystallization. The following sections utilize silicate melt inclusions, trace elements, and other geological information to help constrain the depth and temperature of the magma chamber that fed the eruptions on Alid, and to learn about the conditions related to formation of the granophyric textures.
Dissolved volatile concentrations
The euhedral quartz phenocrysts in both the ‘pf unit’ pumice lumps and granophyre block contain numerous silicate melt inclusions (MI; Fig. 7); the following information is based on analyses of silicate melt inclusions chosen from quartz separates from pumice lumps of the ‘pf unit’. Melt inclusions from the granophyric block were not studied because they are more crystallized than MI in the ‘pf unit’ and all large (>25 µm) inclusions in the granophyric sample appeared to have leaked. Many studies have shown that MI provide a record of the melt composition at the time of inclusion entrapment (Roedder, 1984; Anderson et al., 1989; Johnson et al., 1994; Lowenstern, 1995). Nearly all MI in quartz from the ‘pf unit’ pumice are <100 µm in diameter, and most are <50 µm. They are mostly glass, but contain ∼5% crystals; wiry Fe–Ti oxides, pyroxenes, biotite(?) and other (unidentified) minerals. The MI contain one or more small vapor bubbles, generally <10 µm in diameter, which typically make up <2 vol % of the inclusions. By heating the MI-bearing quartz grains in a muffle furnace at 925°C for 4 h, the inclusions were remelted and homogenized to an optically homogeneous glass. Electron microprobe analyses of different regions in the inclusions revealed no major-element heterogeneities in the homogenized inclusions.
Fourier-transform infrared (FTIR) spectroscopic analyses of six remelted, doubly polished MI (Table 2, Appendix) demonstrated relatively low dissolved H2O concentrations, ranging from 1.99 to 3.40 wt % H2O (mean 2.56 wt %) using the 3570 cm−1 peak. Quantification with the near-IR peaks yielded an average of 2.70 wt %. Water was also estimated by the summation deficit of electron microprobe analyses, assuming that the difference between the analysis total and 100% was due to the presence of water (Devine et al., 1995). Using this technique, the mean of the six MI was 2.62 wt %, consistent with the FTIR results. The mean deficit for 19 inclusions, 13 not analyzed by FTIR spectroscopy, was 2.8 wt %. Assuming that the MI compositions represent those of the silicate melt at the time of inclusion entrapment (Roedder, 1984), the rhyolitic magma apparently contained lower dissolved H2O concentrations than most other rhyolitic systems discussed in the literature (Johnson et al., 1994; Lowenstern, 1995).
Chlorine concentrations in MI were very consistent, and averaged 3800 ppm (2σ=400 ppm, n=19). Fluorine concentrations were more scattered, ranging from 1300 to 5200 ppm and averaging 3300 ppm (2σ= 2400 ppm). Pumiceous matrix glass retained its chlorine, though fluorine was generally absent. This could indicate either preferential degassing of F during eruption, or alternatively, leaching of the F during secular hydration of the pumice.
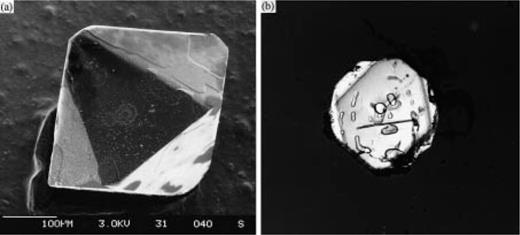
Quartz phenocrysts in pumice of the ‘pf unit’ are euhedral (a) and contain abundant melt inclusions (b). Scale for (a), a scanning electron micrograph, is shown by bar representing 100 µm. Quartz grain in (b) is 650 µm in diameter. Photomicrograph taken with crossed Nicols.
H20 and C02 contents of melt inclusions in quartz from ‘pf unit’ pumice
| Sample* | H2Om† (wt %) | OH−† (wt %) | H2Om+ OH−† | H2Ot† (wt %) | H2O (EPMA) | CO2† (ppm) | PSat (bars) | % CO2v |
|---|---|---|---|---|---|---|---|---|
| 5200 cm−1 | 4500 cm−1 | 5200+4500 cm−1 | 3570 cm−1 | by difference | ||||
| EC96-21.7 | 1.37±0.45 | 1.32±0.45 | 2.69±0.63 | 2.45±0.27 | 2.80 | 48±20 | 530 | 14.0 |
| EC96-21.11 | 1.01±0.38 | 0.99±0.36 | 2.00±0.53 | 1.99±0.24 | 2.78 | 45±13 | 380 | 18.2 |
| EC96-21.12 | 1.25±0.26 | 1.13±0.25 | 2.38±0.36 | 2.33±0.21 | 2.42 | 38±13 | 470 | 12.4 |
| EC96-21.13 | 1.41±0.20 | 1.35±0.20 | 2.76±0.28 | 2.63±0.29 | 2.01 | 48±13 | 590 | 12.6 |
| EC96-21.17 | 1.29±0.17 | 1.29±0.19 | 2.58±0.26 | 2.53±0.25 | 3.20 | 28±11 | 520 | 8.3 |
| EC96-21.19 | 1.75±0.25 | 2.01±0.29 | 3.76±0.38 | 3.40±0.30 | 2.49 | 58±16 | 930 | 9.9 |
| Mean value | 1.35±0.24 | 1.35±0.35 | 2.70±0.59 | 2.56±0.47 | 2.62±0.41 | 44±10 | 570 | 12.6 |
The inclusion-bearing quartz grains were selected individually from crystal separates.
See Appendix for analytical details on FTIR spectroscopy.
EPMA, electron microprobe (see text and Appendix). Psat (saturation pressure) and % CO2v(mol % CO2) in vapor are discussed in text and were calculated with procedure outlined by Holloway & Blank (1994). Errors for FTIR results were calculated as discussed by Lowenstern et al. (1994), using propagation method of Bevington (1969). Reported errors for mean value row are 1 SD around the mean of six inclusions from six quartz grains found within a single pumice lump.
Dissolved carbon dioxide concentrations, also measured by FTIR spectroscopy, were 28–58 ppm for the six MI (Table 2). Many researchers have noted high CO2 in A-type magmatic systems (Bailey & Macdonald, 1987). Association of the Alid rhyolites with numerous younger and older basaltic units (Clynne et al., 1996a, 1996b), makes it likely that significant amounts of CO2 were present in this magmatic system. Even today, fumaroles venting from the summit and flanks of Alid are notably CO2 rich, and have magmatic carbon isotope signatures (Lowenstern et al., 1997). Therefore, the low CO2 concentrations in the melt do not necessitate low CO2 in the Alid magmatic system, but rather may be due to the low pressure at the time of MI entrapment (and thus the low solubility for CO2 in the melt). As discussed below, the assumption that the H2O and CO2 concentrations were controlled by melt–vapor equilibria allows one to calculate pressure of the magma at the time of inclusion entrapment.
H2O–CO2–melt equilibria: implications for magma depth
As demonstrated by Anderson et al., (1989), the concentrations of H2O and CO2 in silicate MI can be used to calculate a minimum pressure at which the inclusion was trapped, as well as the composition of the vapor that would coexist with the melt at that pressure (Psat of Table 2). Holloway & Blank, (1994) outlined a procedure that calculates these parameters by using solubility models for CO2 and H2O in rhyolite along with a Redlich–Kwong model for components of the vapor phase. Using an estimated magma temperature of 875°C (see below), we calculate saturation pressures between 380 and 925 bars, corresponding to depths of 1.4–3.4 km, assuming a lithostatic pressure gradient and rock density of 2700 kg/m3. The vapor in equilibrium with the silicate melt would be composed of ∼10–18% CO2, the rest being water. Other gas components not included in the calculation (HCl, HF, SO2, H2S) would further dilute the CO2 component in the vapor, and permit the observed H2O and CO2 concentrations in the melt at slightly greater pressures.
The low calculated crystallization depths (1.4–3.4 km) are consistent with a variety of geological and mineralogical constraints. First, Alid is a relatively small, steep-sided structural dome formed as a result of intrusion of rhyolitic magma (Clynne et al., 1996a, 1996b). It is unlikely that such a feature could form by an intrusion at depths much greater than 5 km. For example, laccoliths, which form by similar mechanisms, typically have diameters that are a direct function of their depth of intrusion, with the ratio being close to unity (Price & Cosgrove, 1990). Given the diameter of the mountain itself (5–7 km), the intrusion might then have reached <4 km below the surface before erosion, and today would be located 1500–3000 m below Alid's depressed summit (Duffield et al., 1996).
Plausibly, the MI could have been trapped before ascent and shallow emplacement of the rhyolitic magma. However, several lines of evidence are consistent with inclusion entrapment after emplacement. The first rhyolites erupted after deformation are aphyric, and are strikingly similar in bulk composition to the later porphyritic rhyolites (Clynne et al., 1996a). Moreover, the MI were trapped in small, euhedral quartz grains (Fig. 7a and b) that apparently were the last phase to crystallize from the melt. They do not appear to be long lived and show no evidence for decompression-related resorption (Whitney, 1988), which might occur if they had risen from significant depth. Moreover, quartz was not observed in any of the earlier ‘frhy’ units.
Finally, as discussed above, the low CO2 in the MI would be surprising for an A-type rhyolite associated with abundant rift basalts. The low volatile concentrations may therefore directly reflect volatile solubilities in a shallow magma chamber, at 2–4 km beneath the Alid structural dome.
Magmatic temperatures
The presence of a single alkali feldspar is typical of hypersolvus igneous systems where temperature is high and water pressure low. However, it is difficult to quantify temperature simply by the presence of a single alkali feldspar, other than to say that temperature must be above ∼680°C (Tuttle & Bowen, 1958). Lack of ilmenite in the Alid rhyolites precludes use of Fe–Ti oxide geothermometry to calculate pre-eruptive magma temperatures. Similarly, these rhyolites contain only one pyroxene, so that other common pyroxene geothermometers cannot be used.
Elevated Zr concentrations in these rhyolites (Clynne et al., 1996a), hint at a high magma temperature. The Zr geothermometer (Watson & Harrison, 1983) relates zircon solubility to melt composition and the temperature of rhyolitic melts. The Alid rhyolites are all similar in alkali to alumina ratios, and have a subaluminous composition. Whole-rock Zr concentrations, as determined by X-ray fluorescence analysis, range from 362 to 414 ppm for all pyroxene rhyolites from Alid (Duffield et al., 1997), including the aphyric units. Rhyolitic pumice from the ‘pf unit’ pumice and the granophyric block gave concentrations toward the top of this range. Assuming that the accessory zircon crystals contain 65% ZrO2, and that the molar (Na + K + 2Ca)/(Al × Si) is equal to 1.07, temperatures calculated with the aforementioned Zr concentrations yield temperatures between 860 and 880°C (Watson & Harrison, 1983). Reasonable expected variations in melt peralkalinity or zircon compositions would not affect the calculated temperatures more than 20°C. We also used the phosphorus geothermometer of Harrison & Watson, (1984), which yielded similar temperatures (∼850°C) for the ‘pf unit’ pumice and granophyric blocks. Analytical uncertainty in P2O5 analyses (±0.01 wt %) results in uncertainties of ±20°C. Because the Zr and P2O5 geothermometry is based on analysis of whole rocks and not glass separates, the calculated temperatures are maxima. The rhyolites do not contain abundant zircon crystals, but rocks with higher modal zircon may have erupted at somewhat lower temperatures than units with fewer zircon grains and similar Zr concentrations.
As mentioned above, crystals and bubbles in silicate melt inclusions were homogenized at temperatures around 925°C. Temperatures lower than 850°C were insufficient to cause the crystals to melt, and this probably indicates that the original entrapment temperature for the inclusions was higher than 850°C, in accordance with the Zr geothermometer.
Oxygen fugacity is likely to be close to the quartz–fayalite–magnetite (QFM) buffer, given that some of the Alid pyroxene rhyolites also contain fayalite, and those magmas, therefore, contained all three minerals of that buffer. The presence of ferroaugite rather than fayalite, though, permits slightly higher oxidation states, perhaps up to a log unit above QFM. The low presumed oxygen fugacity is consistent with the very low calculated ferric iron concentrations in the clinopyroxene.
Formation of Micrographic Textures Beneath Alid
The pressure, temperature, and stratigraphic constraints discussed above allow us to reconstruct the history of rhyolitic magma intrusion at Alid. Crystal-poor rhyolitic magma ascended to within 1.4–3.4 km of the surface. The intrusions caused uplift and doming of marine sediments, basaltic lavas and amphibole-bearing rhyolites. After deformation, or near its cessation, aphyric rhyolites, along with some sparsely phyric fayalite-bearing and clinopyroxene rhyolites, were erupted along the flanks of the dome and from its summit. Eruption of these early post-doming rhyolites, from 33.5 to 23.5 ka, would have caused degassing and consequent crystallization of the magma remaining below in the shallow intrusion. The magma crystallized until it contained 30–40 vol. % phenocrysts and reached a temperature of about 870±30°C. The depth to the intrusion can be estimated by geologic considerations (the steep-sloped nature of the structural dome) and the solubility of CO2–H2O fluids in rhyolitic magma. We estimate that the quartz phenocrysts in the ‘pf unit’ pumice grew at pressures of 380–925 bars, corresponding to depths of 1.4–3.4 km.
Assuming the magma resided at a level of 2 km depth, a rapid pressure change from lithostatic to hydrostatic conditions (i.e. 540–200 bars) would cause degassing from about 2.8 to 1.6 wt % H2O [using the solubility model of Moore et al., (1995)]. Such a loss of water would cause instantaneous, isothermal undercooling of the melt [∼75°C according to figs 2–7 of Tuttle & Bowen, (1958)], plausibly enough to induce cellular growth of phenocrystic feldspars and consequent formation of the radiating fringes and micrographic textures. Growth of the groundmass texture must have been accompanied by further degassing, as some of the exsolved vapor was trapped as vapor-rich fluid inclusions within the groundmass stringers and in the outer rims of phenocrysts (Fig. 3f and g). The low density (∼2.45 g/cm3) of the granophyric clasts, and their friable nature, are consistent with residual porosity (∼6 vol. %, assuming mean crystal densities of 2.60 g/cm3) formed during crystallization-induced degassing. Feldspar compositions in the groundmass were constrained by the K/Na of the crystallizing melt, as would be expected for systems where diffusion cannot keep pace with the rapid rate of crystal growth.
The most recent eruption (23.5±1.9 ka; Duffield et al., 1997), from the summit basin, resulted in deposition of a thick blanket of pyroclastic flow materials. Granophyric blocks within the upper part of this deposit must have been excavated from the crystalline carapace at the magma chamber walls or roof and were carried to the surface by the erupting jet.
Granophyre Crystallization: Promotion and Prevention
London, (1996) has discussed how high-silica melts are more likely to form pegmatoidal fabrics than other melt compositions. They are easily undercooled as liquids, nucleating relatively few seed crystals before final crystallization and consolidation. Very high rates of undercooling spur growth of spherulites and the crude granophyric intergrowths of intracaldera ignimbrites. Deeper, volatile-rich melts can crystallize more slowly as the coarse graphic textures of granitic pegmatites. The textures discussed herein are intermediate between these two groups. Their development requires the presence of phenocryst hosts from which the skeletal crystals emanate. Low pressure aids their development: magma depth must be sufficiently shallow (<3 km) so that pressure changes can cause enough loss of H2O to drive rapid undercooling. But pressure must remain high enough so that sufficient water remains (>1–1.5 wt %?) to allow adequate diffusional transport of melt components for the growing crystal nuclei.
Another critical control on granophyre formation must be the actual loss of water and growth of vesicles attendant to depressurization. Significant magma vesicularity should stunt growth of the granophyric stringers, providing no room for development of growing crystals. Under some circumstances, though, the growth of granophyre in subvolcanic settings may be delayed until magma-vesicle suspensions can collapse, allowing separation and release of the vapor and consequent annealing of the undercooled silicate liquid and its crystals. At that point, crystallization could commence from a more spatially continuous melt phase. Crystallization of the skeletal intergrowths of anhydrous quartz and feldspar will continue to drive water out of the melt phase, forming bubbles. In the Alid granophyre, the presence of numerous, primary vapor-rich inclusions throughout the granophyric groundmass clearly demonstrates this process (Fig. 3g).
Magmas that ascend close to the surface without erupting can be undercooled quickly by: (1) isothermal depressurization and associated degassing, (2) adiabatic cooling by exsolving, expanding vapor, and (3) convecting, superjacent hydrothermal systems. When silicic magmas are present in such a setting, their tendency to become supercooled and crystallize as granophyre will be maximized.
Acknowledgements
W. A. Duffield, G. Kahsai, J. Smith, T. Tesfai, K. Woldemariam, and L. Woldegiorgis helped with fieldwork. We thank D. Siems of the USGS, and D. Johnson & Charles Knaack of Washington State University for major- and trace-element analyses by X-ray fluorescence and inductively coupled plasma mass spectrometry. L. Calk and R. Oscarson assisted with the electron microprobe and scanning electron microscope at the USGS. Peter Larson of Washington State University ran the samples for their oxygen isotope compositions. We appreciate helpful reviews by E. duBray, D. Lentz, P. Lipman and T. Vogel. This work was supported by the Eritrean Ministry of Energy, Mines and Water Resources, the US Agency for International Development, and the USGS Volcano Hazards Program.
References
Appendix: Analytical Procedures
Infrared spectroscopy
Spectra were collected on a Nicolet Magna 750 Fourier transform infrared (FTIR) spectrometer with an attached SpectraTech Analytical-IR microscope that utilizes a liquid-N2-cooled, MCT-A detector. The entire system is purged with dry air and is located at the US Geological Survey in Menlo Park, CA. The microscope can acquire usable spectra of spots down to 15 µm in size. Between 1024 and 4096 scans were collected at 4 cm−1 resolution from 400 to 6000 cm−1. All spectra were collected with unpolarized light. Quantification for H2O was done using equation (15) of Ihinger et al. (1994) as well as extinction coefficients listed in that paper. The 3570 cm−1 peak was used to quantify total water, H2Ot (ε=80), and the near-IR peaks at 5200 and 4500 cm−1 were used to quantify molecular water (H2Om) and hydroxyl (OH−), respectively (ε=1.86 and 1.50). Carbon dioxide was calculated with an extinction coefficient of 1077±80 (Blank, 1993). We assumed glass density of 2.35 g/cm3.
Electron microprobe
Maps of K, Ca and other elements in feldspar were made by using a 50 nA beam focused to a 2 or 3 µm spot while rastering the stage in increments of the same size in grids up to 3 mm on a side. The five-spectrometer JEOL 8900 electron microanalyzer was set to count each spot for a set time, usually 95 or 150 ms. Most maps took 10–16 h to collect. Quantitative analyses on individual spots in feldspar grains were done with a 25 nA beam focused to a 10 µm spot with count times of 20 s on peak and background. Standards included Tiburon albite (for Na, Al and Si), OR1 (for K), An 100 glass (for Ca), barite (Ba), Sr carbonate, and synthetic fayalite (for Fe). Estimated uncertainties are ±1% relative for oxides of Si and Al, 3% for Na, Ca and K, and 10% for Ba, Fe and Sr. Biotite and pyroxene analyses were done with similar operating conditions but with well-characterized natural and synthetic standards more appropriate for those minerals. Glass analyses of melt inclusions and pumiceous matrix utilized a 7.5 nA beam focused to a 25 µm spot. Sodium was counted for 10 s, Cl, S, F and Mg for 30 s, and all other elements for 20 s. Scans of Na counts vs time were carried out to insure that the operating conditions did not cause migration of Na away from the electron beam.
Isotopes
Whole-rock samples were run at Washington State University by Dr Peter Larson according to methods outlined by Larson & Zimmerman (1991). Because of possible hydration of the pumiceous matrix of the ‘pf unit’ pumice, we prepared a feldspar separate as a proxy for the whole rock. Given that melt–feldspar fractionation of oxygen is generally close to zero (Larson & Taylor, 1986), this should be a good approximation for the pristine whole-rock composition.
Radiogenic isotopes were quantified at the USGS in Menlo Park in the laboratory of T. Bullen. Estimated errors for similar samples and analytical procedures have been outlined by Bullen & Clynne (1990). Complete data have been given by Clynne et al. (1996a) and Duffield et al. (1997).
Bulk-rock chemistry
Whole-rock major-element analyses were carried out by D. Siems, USGS, according to methods outlined by Taggart et al. (1987). Estimated uncertainties have been published by Bacon & Druitt (1988). Trace elements were analyzed by XRF and ICP-MS at Washington State University. Errors and analytical techniques have been discussed by Hooper et al. (1993) and Knaack et al. (1994).
