


Abstract
High-precision compositional analyses of 54 whole-rock samples from the ad 1783 Laki lava flow field show small but statistically significant variations in trace and major element concentrations and ratios. Strong linear correlations exist between major and trace element concentrations, and variations in incompatible element ratios, such as Zr/Y, are modest. Point-counting results indicate that the lava contains an average of 12 vol. % phenocrysts, with plagioclase, clinopyroxene and olivine present in relative volumetric proportions of 57:32:11. Whole-rock compositions vary linearly with the total mass fraction of phenocrysts in the samples, such that samples with the lowest concentrations of incompatible trace elements have the highest proportion of phenocrysts. On first inspection, such correlations might be interpreted to arise from variable crystal accumulation into the carrier liquid within the magma. However, simple models of crystal accumulation fail to match the relationships between whole-rock composition and phenocryst content. Instead, the phenocrysts must have formed the solid part of a magmatic mush, with the mush liquid being more evolved than the carrier liquid. This mush was entrained into the carrier liquid prior to eruption, with incomplete mixing of the mush into the carrier liquid allowing for the preservation of whole-rock compositional variation. A mathematical description of the mass balance involved in mush mixing is developed to constrain the properties of the mush. Although there is a trade-off between estimates of mush liquid composition and mush porosity, independent constraints on mush liquid composition from phenocryst compositions are used to estimate an average mush porosity of 46–65%. The success of the binary mixing fits to whole-rock compositions indicates that the mean compositions of the mush and the carrier liquid cannot have changed substantially during the eruption. However, more detailed observations reveal that on average the mush proportion was higher during the later stages of the eruption, and this coincides with the presence of primitive high Mg# olivine and clinopyroxene and anorthitic plagioclase primocrysts in the mush. The key observations cannot be accounted for by a model of in situ evolution of mush liquid in the cooling margins of a magma chamber. Instead, the juxtaposition of evolved mush liquid with primitive phenocrysts that is required to generate the mush may perhaps occur as a result of compositional convection at the chamber roof, or alternatively by the partitioning of phenocrysts into more viscous magma during the mixing of primitive basalt and evolved melt in the chamber. It is likely that many porphyritic basaltic eruptions carry disaggregated mush and it is straightforward to apply the methods described in this study to other eruptions, allowing for future improvements in the characterization of the properties of mushes in basaltic magma chambers.
INTRODUCTION
Compositional variability within single lava flows
Although the identification of compositional variation within the products of single eruptions can provide information about magmatic processes, few lava flow fields have been studied in detail (Fitton et al., 1983; Rhodes, 1983; Sigmarsson et al., 1991; Thordarson et al., 1996; Rubin et al., 2001; Maclennan et al., 2003; Eason & Sinton, 2009). Glasses and whole-rock samples from single eruptions exhibit compositional variation that has been attributed to fractional crystallization, melt–rock reaction, crystal accumulation, fractional melting and mantle heterogeneity. The preservation of compositional variation in the erupted products requires that homogenization of the magma by mixing has not gone to completion. Therefore, compositional heterogeneity can be used not only to study the processes that generate variability, but also to examine the evolution of compositional homogenization by mixing (Maclennan, 2008). Evaluation of temporal and spatial patterns in the composition of the products of single eruptions has also provided constraints on the operation of such mixing processes. Whereas Sigmarsson et al. (1991) reported remarkable homogeneity in the trace element and isotopic composition of whole-rock samples from the ad 1783 Laki eruption, the major element compositions of tephra glasses from the study of Thordarson et al. (1996) display significant heterogeneity.
The aim of the present study was to investigate the magnitude and origins of compositional heterogeneity with the products of the ad 1783 Laki eruption in Iceland. The principal finding is that the composition of whole-rock samples is controlled by the variable addition of a liquid–crystal mixture, perhaps a mush or slurry, into a homogeneous basaltic liquid. Therefore, the study of compositional variation within lava produced by one eruption can potentially be used to provide a link between the volcanic and plutonic records of magma chamber processes. The importance of disaggregation of mush into basaltic eruptions has recently been highlighted by the examination of melt-bearing nodules of gabbroic and peridotitic material in basalts from mid-ocean ridges and ocean islands (Gurenko & Sobolev, 2006; Ridley et al., 2006; Holness et al., 2007) and by inspection of phenocryst compositions in porphyritic basalts (Hansen & Grönvold, 2000; Halldórsson et al., 2008; Costa et al., 2010). The methods presented here use the relationship between the whole-rock compositions and phenocryst content of single samples to constrain the properties of crystal–liquid mixtures present in the magmatic system prior to eruption and can be applied to any lava flow field where such data are available. The estimated properties may be used to inform the fluid dynamical modelling of magmatic processes and to improve understanding of the triggering and evolution of large volcanic eruptions.
Magmatic setting
The ad 1783 Laki eruption took place between 8 June 1783 and 7 February 1784 in the Eastern Volcanic Zone (EVZ) of Iceland (Fig. 1). This volcanic zone has been active for the last 2–3 Myr (Sæmundsson, 1974) and now accommodates much of the plate spreading in southern Iceland, with spreading being transferred from the Western Volcanic Zone (WVZ) to the EVZ (LaFemina et al., 2005). The EVZ is thought to be propagating southwards, with the Vestmanneyjar archipelago sitting near its southern tip. At the present day the rate of spreading across the northern part of the EVZ is similar to that of the full spreading rate of the North American and European plates, whereas the spreading rate near the southern end of the EVZ is close to zero (LaFemina et al., 2005). There is a corresponding shift in the composition of the erupted material with latitude in the EVZ: The Grímsvötn volcanic system, which hosts Laki, and the Bárðarbunga–Veiðivötn volcanic system occupy the northern part of the EVZ and are composed largely of tholeiitic basalt, whereas transitional and alkali basalts are erupted farther south through the Katla, Eyjafjallajökull and Vestmannaeyjar systems (e.g. Jakobsson, 1979). Magmatism on the EVZ is typified by flood lava eruptions and the present-day landscape of the ice-free, on-land segments of the volcanic systems is strikingly influenced by the products of a series of Holocene flood lava eruptions. Large events (≥1 km3) have occurred throughout the Holocene with repose times of hundreds of years, including the significant eruptions of 8·6 ka Thjórsarhraun, ad 934 Eldgjá and ad 1783–1784 Laki (e.g. Thordarson et al., 2003a; Thordarson & Larsen, 2007). Such large, long-lived eruptions have historically produced significant environmental and societal impacts (Larsen, 2000; Thordarson et al., 2001, 2003b; Thordarson & Self, 2003) and it is therefore desirable to be able to use the petrology of these flows to understand the processes that occur prior to large-volume fissure eruptions.
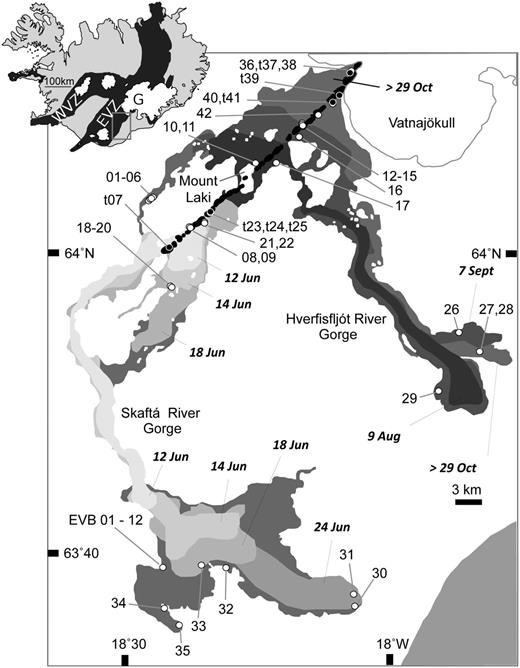
Map showing the growth of the ad 1783 Laki lava flow field with time, including the reconstructed position of the lava front at a particular date. The inset map of Iceland at the top left shows the extent of the active volcanic rift zones (black) and permanent glaciers (white). The approximate position of the Grímsvötn caldera is shown as G and the Eastern Volcanic Zone (EVZ) and Western Volcanic Zone (WVZ) are also marked. The main figure is an enlargement of the area outlined on the inset map. The Laki cone-row is the linear feature shown in black, trending from fissure 1 in the SW to fissure 10 in the NE. The sample locations for this study are shown as circles. Open circles are lava sample locations; filled black circles with white rims are tephra sample locations and the numbers are the LAK sample numbers. EVB indicates the location of lava samples taken from a vertical profile through a single flow lobe at Eldvatnsbrú. The date of emplacement of each lava lobe in ad 1783 is indicated.
The Laki eruption
The 8 month long Laki flood lava eruption of ad 1783–84 is the best documented small-scale analogue of a flood basalt eruption to date (Thordarson & Self, 1993, 1998). The Laki vent system is part of the Grímsvötn volcanic system, which is inferred to be ∼100 km long and 15 km wide (Jakobsson, 1979) and features the ice-capped Grímsvötn central volcano (Fig. 1, inset). The Laki eruption was part of a volcano-tectonic episode that affected the whole system and lasted for more than 2 years (Thordarson et al., 2003b). The Grímsvötn system has produced tholeiitic lava flows throughout the Holocene, and has erupted at least 70 times since the settlement of Iceland, making it the most active volcanic system in Iceland’s recorded history (Thordarson & Larsen, 2007, and references therein). The site of the ad 1783 eruption is a 27 km long vent system marked by a row of scoria and spatter cones defining 10 en echelon fissure segments. The vent system dissects the pre-existing hyaloclastite mound, Laki, from which the eruption takes its name (Thordarson & Self, 1993).
A detailed description of the physical volcanology of the eruption has been given by Thordarson & Self (1993) and Thordarson et al. (2003b), including estimates of the volume of the eruption products, the eruption sequence and effusion rates. The Laki eruption was the second largest in Iceland’s recorded history after the ad 934–938 Eldgjá event (e.g. Larsen, 2000; Thordarson et al., 2001). Laki produced ∼14·7 km3 of quartz-tholeiite basalt, plus ∼0·4 km3 of tephra, from 10 en echelon fissures erupting sequentially over the 8 months of activity. In the course of the eruption, outpourings of basalt magma created a flow field that extends from the SW margin of Vatnajökull to the coast, covering an area of ∼600 km2. The onset of the eruption was preceded by several weeks of increased seismic activity, which was described in contemporary accounts (Thordarson et al., 2003a). The fissure-forming period of the eruption lasted for 8 months and can be split into 10 eruptive episodes, corresponding to 10 separate lava surges. The timing of the opening of single fissures is well constrained from eyewitness accounts and a detailed tephrochronology study, which reveals that the fissures opened in sequence, propagating to the NE in the direction of the Grímsvötn central volcano. The opening and closing of each fissure can be considered a single eruption episode. The beginning of each new episode was marked by seismic activity of increasing intensity associated with the opening of a new fissure. Fissure opening was marked by a 0·5–1 day long explosive eruption phase of violent strombolian to sub-plinian intensities, each producing distinct tephra fall units (Thordarson & Self, 1993). Fire fountains from the initial episodes are thought to have reached heights of up to 1400 m. Two fissures involved phreatomagmatic activity that produced physically distinctive tephra units and were not included in the sampling for this project. The explosive activity on each fissure gave way to a longer-lasting (days to weeks) phase of weaker lava-fountaining and lava effusion. This cycle of activity defines a single eruption episode. The lava flows of episodes I–V (8 June–27 July 1783) formed the western branch of the Laki lava flow field, which was discharged through the Skaftá River gorge and the Varmá–Hellisá valley complex down onto the Síða coastal plain. Lava episodes VI–X (28 July to end of October 1783) were emplaced further to the east, covering the flood plain of the Skaftá River to the NE of Mt Laki, and discharging down the Hverfisfljót River gorge and onto the Síða coastal plain (Fig. 1). In general, the loci of activity shifted in sequence to the NE, gradually constructing the row of scoria and spatter cones that defines the vent system today.
SAMPLE COLLECTION
Samples were collected in three field seasons between 2004 and 2006, and consist of 47 basalt hand specimens and seven magmatic tephra samples. Sample locations are shown in Fig. 1. Fresh, glassy tephra samples were obtained from proximal deposits around the Laki cone-row by digging down through the surface cover. Lava samples were collected from across the lava flow field, including proximal areas by the cone-row and distal margins of single lava flows. Samples were not collected from portions of the lava flow that showed obvious alteration or segregation structures, which are known to cause local perturbations in whole-rock trace element composition. Large-scale segregation structures were rare in the outcrops that were sampled, and were not observed in the hand specimens. Samples containing oxidized olivine crystals or mud-filled vesicles were discarded. Of the 47 lava samples, 12 were taken from a single outcrop at Eldvatnsbrú, at 25–30 cm intervals throughout the vertical thickness of a single flow lobe.
A hand-held GPS was used to determine the latitude and longitude of the sample locations, which are accurate to within 7 m. The samples are also well constrained in terms of timing of emplacement. Contemporary accounts of the Laki eruption that have been appraised in recent literature (Thordarson et al., 2003a), plus detailed field observations made during sampling, were used to tie the lava and tephra samples to particular fissure segments on the Laki cone-row. Maps showing the evolution of the lava flow fronts through time were used to support the field observations (Fig. 1). Sample locations, types and associated fissure events are provided in Supplementary Data (available for downloading at http://www.petrology.oxfordjournals/org).
PETROGRAPHIC OBSERVATIONS
Vesicularity and modal proportions of phenocryst phases and total groundmass were estimated for each of the 47 lava samples and three of the tephra samples by point-counting of thin-sections. A manually operated mechanical slide holder, movable in <0·2 mm increments in the x- and y-axes, was affixed to the stage of a petrological microscope and used to count single points in straight lines on each thin section. The phases counted were phenocrysts of plagioclase, olivine, and clinopyroxene, plus vesicles and groundmass, where groundmass is a cover-all term to indicate all small crystals and/or glass. It should be noted that groundmass crystal phases were not counted as single crystal types, but counted towards the total groundmass fraction. Although oxides were present as groundmass crystals in crystalline lava samples, they were never observed as phenocrysts or in crystal clots. Sulphides were not observed and have not been previously reported from Laki samples. Phenocrysts were defined based on strict size criteria and by their textural relationship to the groundmass. Point-counting was carried out using a binocular microscope with a ×10 objective and each large crystal was roughly measured as it appeared under the cross-hair on the microscope optics. Two types of phenocryst occur in the samples: lone phenocrysts (Fig. 2a, c and e) and those within glomerophyric clusters (Fig. 2b, d and e). Both types of phenocryst have the same size range, where plagioclase is 150–2000 µm (although exceptionally >2 mm to <8 mm), and clinopyroxene and olivine are 200–1000 µm (although exceptionally clinopyroxene is >2 mm to <8 mm). Any crystal smaller in its longest dimension than the size range defined in Table 1 was counted as part of the groundmass. This size scheme is similar to the size classification used for Laki phenocrysts in glassy lava selvages by Guilbaud et al. (2007), although their criterion for olivine phenocrysts is any crystal >500 µm, whereas this study counts any olivine crystal >200 µm as a phenocryst. Each sample was also classified into one of three types depending on the grain size of the groundmass, and the consequent textural distinction between the phenocryst phases and the groundmass (Table 1). Type 1 samples have a glassy to very fine-grained groundmass, hence the distinction between phenocryst and groundmass phases is very clear. Type 2 samples have a slightly coarser groundmass, but retain an obviously porphyritic texture. Type 3 samples have no glass in the groundmass and show a continuum in grain sizes between phenocrysts and groundmass, and have a seriate texture where large groundmass crystals almost overlap in size range with small phenocrysts. It should be noted that the range in phenocryst sizes is the same across all three types. Photomicrographs of phenocryst-poor samples for each textural type are shown in Fig. 3 and phenocryst-rich samples for each textural type are shown in Fig. 4. Over 1000 points were counted for each sample, normalized to 100% and then re-calculated as dense-rock equivalents (vesicle-free). Crystal mass fractions were determined by multiplying the percentage dense-rock equivalent of each phase by the density of the phase. Densities used were 2·78 g cm−3 for plagioclase, 3·27 g cm−3 for olivine, 3·29 g cm−3 for clinopyroxene and 2·76 g cm−3 for groundmass or glass. The errors associated with the point-counting results were estimated in two ways: first, by making repeat measurements of the same sample, which gives good error estimation, but is time-consuming; second, by using counting statistics, which provides minimum estimates of the actual errors. These methods are described in the following subsections and the results are presented in Supplementary Data.
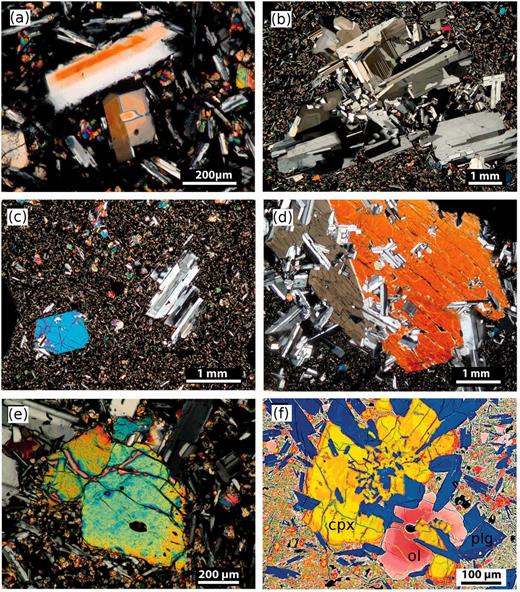
Photomicrographs to illustrate the difference between lone phenocrysts and glomerophyric aggregates. (a)–(e) are digital photomicrographs taken under crossed polars and (f) is a false-colour back-scattered electron SEM image. (a) Sample LAK01 showing lone plagioclase phenocrysts. (b) LAK06 showing a plagioclase crystal cluster. (c) LAK08 showing a lone, euhedral clinopyroxene phenocryst at the bottom left. (d) LAK12 showing an exceptional, large clinopyroxene phenocryst forming an ophitic texture with plagioclase. (e) LAK28 showing a lone olivine phenocryst. (f) LAK11 showing an olivine phenocryst (labelled ol) in a glomerophyric cluster with clinopyroxene (cpx) and plagioclase (plg).
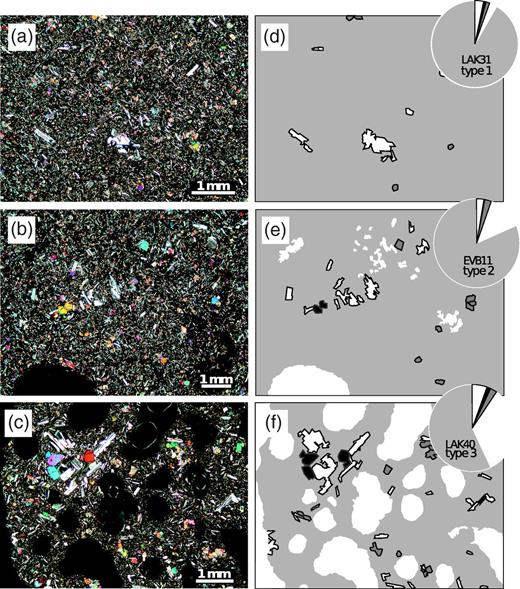
Photomicrographs and illustrations of portions of thin sections to demonstrate the textural relationships between phenocrysts and groundmass for the phenocryst-poor end-members of each of the three textural types of whole-rock sample: (a) Type 1, LAK31; (b) Type 2, EVB11; (c) Type 3, LAK40. (a)–(c) are digital photomicrographs taken under crossed polars; (d)–(f) are interpreted maps showing the definitions of phenocrysts for this field of view. White filled regions with black outlines are plagioclase, mid-grey filled regions with dark outlines are clinopyroxene and black filled regions are olivine phenocrysts. The light grey background fill covers the groundmass and the white regions without outline are vesicles.The pie charts at the top right of each block diagram indicate the relative volume proportions of groundmass, vesicles, plagioclase, olivine and clinopyroxene in each sample, as measured by point-counting and using the same shading and outline scheme as the map. It should be noted that the area shown here for each sample is only a small portion of the entire thin section, and therefore may not be adequately represented by the pie chart.
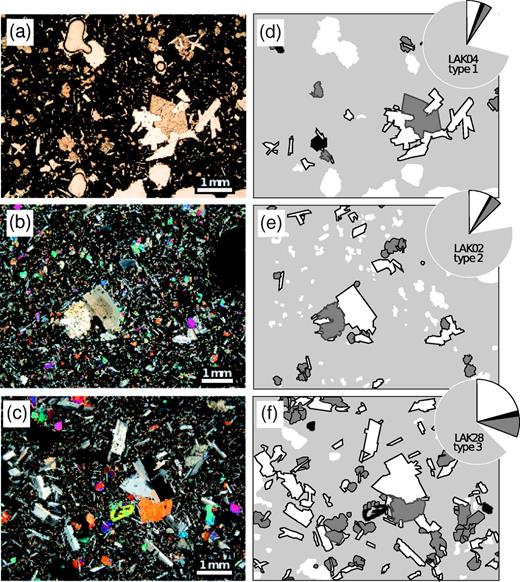
As for Fig. 3 but for phenocryst-rich end-members of each of the three textural types of whole-rock sample: (a) Type 1, LAK04; (b) Type 2, LAK02; (c) Type 3, LAK28; (d)–(f) relate to the photomicrograph to their left.
Textural classifications of Laki lava samples
| n | Texture | Groundmass | Plagioclase (µm) | Clinopyroxene (µm) | Olivine (µm) | |
|---|---|---|---|---|---|---|
| Type 1 | 31 | Porphyritic | glassy to ≤100 µm* | >150 | >200 | >200 |
| Type 2 | 17 | Porphyritic | glassy to ≤150 µm | >150 | >200 | >200 |
| Type 3 | 6 | Seriate | >50 µm to ≤150 µm | >150 | >200 | >200 |
n, number of samples of this type.
*These criteria for phenocryst sizes were applied during point-counting. It should be noted that the maximum and minimum phenocryst sizes are measured directly from the thin section, from randomly oriented crystals, and therefore probably underestimate the true crystal sizes.
Error estimates using repeat measurements on the same sample
At least three, and a maximum of five, repeat measurements were made for all thin sections at different times. Independent repeat measurements were performed by three of the authors and were found to be in good agreement. The thin section used for each sample was assumed to be representative of the sample as a whole, an assumption that is validated later in this study by the description of a strong correlation between point-counting results and the whole-rock compositions. Other assumptions made were that phenocryst phases were randomly distributed throughout the sample and did not form a fabric, and that the criteria used to define a phenocryst were applied to each sample consistently. A representative sample from each of the three textural types was point-counted five times to estimate the maximum error associated with modal proportion estimations of each phase. Type 3 samples had the greatest errors, as phenocrysts are more difficult to distinguish from groundmass crystals when the sample texture is seriate. The 1σ relative precision calculated across all samples is ±18·4% for plagioclase, ±45·5% for olivine, ±33·6% for clinopyroxene and ±6·0% for all phenocrysts.
Error estimates using counting statistics
Two-sided binomial confidence intervals were calculated about the sample mean using equation (11) of Howarth (1998). The 1σ relative precision calculated across all samples is ±9·3% for plagioclase, ±27·8% for olivine, ±12·8% for clinopyroxene and ±6·6% for all phenocrysts. Because the errors from the repeats are similar to or larger than those from the counting statistics, the errors from the repeats on each sample are used as the error estimates in the figures and calculations provided in this study.
Point-counting results
The mean phenocryst content of the Laki samples is 12% by mass, slightly higher than previous estimates for tephra and lava surface samples from Guilbaud et al. (2007). The total range of phenocryst contents is from 5 to 34%. The relative proportions of the phenocryst types in each sample are shown in Fig. 5. The mean proportions of the phenocryst phases by mass are plg:ol:cpx in the ratio 54:11:35. As demonstrated in Fig. 5, these proportions are very similar to the eutectic compositions expected for low-pressure crystallization of olivine–plagioclase–clinopyroxene-saturated basalts (Yang et al., 1996).
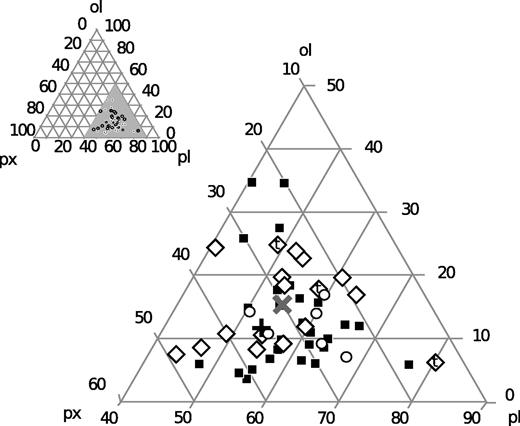
Ternary plot of the relative proportions of plagioclase (pl), olivine (ol) and clinopyroxene (px) phenocrysts in Laki basalt samples, as measured by point-counting. The larger figure is an enlargement of the grey-shaded region on the inset diagram. Diamonds represent Type 1 lavas, squares are Type 2 and circles are Type 3. The three Type 1 symbols labelled ‘t’ are tephra samples. The black cross (+) represents the average of all samples, and the grey cross (×) represents a low-pressure eutectic basaltic crystallization assemblage (Yang et al., 1996).
ANALYTICAL METHODS
High-precision X-ray fluorescence spectrometry
A total of 54 Laki lava and tephra samples were collected for this study. Each fist-sized rock sample was cut into ∼10 cm3 sized chunks, cleaned with distilled water and dried overnight in a low-temperature oven. A homogeneous whole-rock powder of each sample was made by crushing the chunks in a tungsten-carbide jawcrusher and grinding the chips to a fine powder in a tungsten-carbide GYRO mill, which were both thoroughly cleaned between samples to prevent powder contamination. Each powdered sample was then prepared for and analysed by X-ray fluorescence (XRF) spectrometry to determine the concentrations of major and trace elements. Analyses were performed on samples using a Philips PW 2404 automatic XRF spectrometer at the University of Edinburgh. Analytical conditions were similar to those given by Fitton et al. (1998) with modifications noted by Fitton & Godard (2004). Major-element oxide concentrations were measured for each sample on homogeneous glass discs, which were prepared by a method similar to that described by Norrish & Hutton (1969). Rock powders of each sample were dried overnight at 110°C and a nominal, but precisely weighed, 1 g sample was ignited for 20 min at 1100°C in a Pt5%Au crucible then reweighed to determine loss on ignition (LOI). The cooled residue was carefully mixed with Johnson Matthey Spectroflux 105 (lithium borate with a La2O3 heavy absorber) in a sample-to-flux ratio of 1:5, calculated from the unignited sample weight. The ignited powder and the flux were fused for 20 min at 1100°C in a muffle furnace, and swirled in the crucible whilst still molten to ensure that the flux was completely dispersed. Cooled samples were re-weighed, and any weight lost was made up by adding extra flux. Samples were fused for a second time over a Meker burner, swirling the molten mixture throughout heating to homogenize it, then cast on a graphite mold on a 220°C hotplate, and pressed with an aluminium plunger to create a flattened disk. Trace element concentrations were measured for all samples from pressed powder pellets. The pellets were made according to the following method. Approximately 8 g of powdered sample was used for each analytical pellet. The powder was mixed with 8 drops of a 2% aqueous solution of PVA to bind it, then placed into an aluminium cup and pressed into a flattened 40 mm diameter disc in an automatic press under a load of 8 tonnes. LOI was negative for all samples owing to mass gain from the oxidation of iron, with an average LOI of −0·66%.
Long counting times were used for the trace element analyses, and analyses for both trace and major elements were repeated on each sample four times to estimate internal precision. Data obtained during three different analytical runs over an 18 month period were corrected internally using correction factors derived by re-analysing the most evolved and depleted samples from each sample batch. Accuracy was estimated by analysing homogeneous basalt standards of known compositions, including BHVO-1, BCR-1, and BIR-1, which bracketed the range of concentrations in the unknowns. Compositional data for the Laki whole-rock samples are presented in Supplementary Data and accuracy and precision estimates are presented in Supplementary Data. The conclusions drawn in this study require that geochemical variation in the Laki whole-rock samples have true variation, σt, that exists beyond the effects of analytical noise. The method of Maclennan et al. (2003) was used to estimate the effect of analytical noise introduced by incomplete mixing of the sample powder before sample preparation, or heterogeneous contamination, on σt. Five of the samples (LAK04, LAK10, LAK13, LAK18 and LAK26) were prepared as two pressed powder pellets that were analysed four times each, giving a total of 40 analyses per element. The eight repeats on each sample were used to calculate σrs, a precision estimate that includes machine noise, plus heterogeneity imparted to the sample during preparation for analysis. The four repeats on each pellet were used to calculate σrp, which estimates machine noise only. The variability between pellets of the same sample, σh, is an estimation of heterogeneity imparted to the sample during preparation for analysis only, and is estimated by σh2 = σrs2 − σrp2. This heterogeneity from disk to disk is estimated to contribute less than 0·5% error to the analyses for all elements. The analytical noise estimates shown as σr in Table 2 are based on σrs.
Geochemical variability in whole-rock major and trace elements across the Laki lava flow
| n | Min. | Max. |  | σo | σr | σt | σt/σr | P% | V% | |
|---|---|---|---|---|---|---|---|---|---|---|
| SiO2 | 54 | 49·99 | 50·45 | 50·28 | 0·1 | 0·03 | 0·09 | 2·79 | 0·06 | 0·18 |
| Al2O3 | 54 | 13·5 | 14·25 | 13·74 | 0·2 | 0·04 | 0·2 | 4·66 | 0·31 | 1·44 |
| FeOT | 54 | 12·88 | 13·7 | 13·42 | 0·17 | 0·01 | 0·17 | 13·2 | 0·1 | 1·29 |
| MgO | 54 | 5·64 | 5·88 | 5·78 | 0·07 | 0·02 | 0·07 | 3·53 | 0·33 | 1·16 |
| CaO | 54 | 10·25 | 10·64 | 10·41 | 0·07 | 0·01 | 0·07 | 6·61 | 0·11 | 0·7 |
| Na2O | 54 | 2·61 | 2·77 | 2·69 | 0·06 | 0·02 | 0·05 | 3·6 | 0·56 | 2·02 |
| K2O | 54 | 0·4 | 0·43 | 0·42 | 0·01 | 0 | 0·01 | 2·29 | 0·53 | 1·22 |
| TiO2 | 54 | 2·6 | 2·82 | 2·75 | 0·04 | 0·01 | 0·04 | 6·33 | 0·25 | 1·61 |
| MnO | 54 | 0·22 | 0·23 | 0·22 | 0 | 0 | 0 | 0·29 | 1·47 | 0·43 |
| P2O5 | 54 | 0·26 | 0·31 | 0·29 | 0·02 | 0 | 0·02 | 8·75 | 0·68 | 5·92 |
| La | 42 | 12·62 | 14·27 | 13·53 | 0·37 | 0·21 | 0·31 | 1·48 | 1·53 | 2·26 |
| Ce | 42 | 31·73 | 35·71 | 33·9 | 0·9 | 0·53 | 0·72 | 1·35 | 1·58 | 2·14 |
| Pr | 42 | 4·46 | 5·02 | 4·78 | 0·13 | 0·07 | 0·11 | 1·69 | 1·39 | 2·34 |
| Nd | 42 | 21·03 | 23·75 | 22·48 | 0·6 | 0·44 | 0·41 | 0·94 | 1·95 | 1·82 |
| Sm | 42 | 5·65 | 6·39 | 6·07 | 0·16 | 0·11 | 0·11 | 1 | 1·86 | 1·86 |
| Eu | 42 | 1·84 | 2·07 | 1·97 | 0·05 | 0·03 | 0·04 | 1·22 | 1·61 | 1·97 |
| Gd | 42 | 6·39 | 7·24 | 6·85 | 0·18 | 0·1 | 0·15 | 1·61 | 1·39 | 2·23 |
| Tb | 42 | 1·05 | 1·18 | 1·12 | 0·03 | 0·02 | 0·02 | 0·89 | 2 | 1·78 |
| Dy | 42 | 6·35 | 7·26 | 6·85 | 0·18 | 0·13 | 0·13 | 1·01 | 1·84 | 1·87 |
| Ho | 42 | 1·26 | 1·43 | 1·35 | 0·04 | 0·02 | 0·03 | 1·63 | 1·55 | 2·53 |
| Er | 42 | 3·54 | 4·01 | 3·81 | 0·11 | 0·07 | 0·08 | 1·1 | 1·95 | 2·13 |
| Tm | 42 | 0·53 | 0·61 | 0·58 | 0·02 | 0·01 | 0·02 | 1·3 | 2·1 | 2·73 |
| Yb | 42 | 3·14 | 3·65 | 3·4 | 0·1 | 0·05 | 0·09 | 1·72 | 1·48 | 2·54 |
| Lu | 42 | 0·47 | 0·53 | 0·5 | 0·01 | 0·01 | 0·01 | 1·32 | 1·21 | 1·59 |
| Nb | 54 | 18·31 | 20·86 | 19·88 | 0·4 | 0·1 | 0·39 | 4·01 | 0·49 | 1·95 |
| Zr | 54 | 173·89 | 191·47 | 185·09 | 2·92 | 0·35 | 2·9 | 8·38 | 0·19 | 1·57 |
| Y | 54 | 38·84 | 42·45 | 41·08 | 0·64 | 0·18 | 0·61 | 3·48 | 0·43 | 1·49 |
| Sr | 54 | 228·34 | 240·16 | 234·21 | 2·61 | 0·35 | 2·58 | 7·44 | 0·15 | 1·1 |
| Rb | 54 | 7·56 | 8·21 | 7·83 | 0·14 | 0·17 | — | — | 2·2 | — |
| Zn | 54 | 111·15 | 140·14 | 125·46 | 6·35 | 0·97 | 6·28 | 6·46 | 0·78 | 5 |
| Cu | 54 | 94·75 | 121·73 | 100·03 | 5·29 | 0·64 | 5·25 | 8·15 | 0·64 | 5·25 |
| Ni | 54 | 35·02 | 46·68 | 39·38 | 2·6 | 0·55 | 2·54 | 4·65 | 1·39 | 6·46 |
| Cr | 54 | 50·13 | 75·39 | 58·06 | 5·33 | 0·77 | 5·27 | 6·82 | 1·33 | 9·08 |
| V | 54 | 345·9 | 424·08 | 387·27 | 16·08 | 2·24 | 15·93 | 7·13 | 0·58 | 4·11 |
| Ba | 54 | 83·62 | 94·48 | 89·44 | 2·1 | 3 | — | — | 3·36 | — |
| Sc | 54 | 39·18 | 47·11 | 42·36 | 2·1 | 0·72 | 1·97 | 2·72 | 1·71 | 4·64 |
| Zr/Y | 54 | 4·46 | 4·55 | 4·51 | 0·02 | 0·02 | — | — | 0·49 | — |
| Nb/Zr | 54 | 0·1 | 0·11 | 0·11 | 0 | 0 | 0 | 1·75 | 0·51 | 0·89 |
| La/Yb | 42 | 3·91 | 4·07 | 3·99 | 0·04 | 0·03 | 0·03 | 0·9 | 0·83 | 0·75 |
| n | Min. | Max. | | σo | σr | σt | σt/σr | P% | V% | |
|---|---|---|---|---|---|---|---|---|---|---|
| SiO2 | 54 | 49·99 | 50·45 | 50·28 | 0·1 | 0·03 | 0·09 | 2·79 | 0·06 | 0·18 |
| Al2O3 | 54 | 13·5 | 14·25 | 13·74 | 0·2 | 0·04 | 0·2 | 4·66 | 0·31 | 1·44 |
| FeOT | 54 | 12·88 | 13·7 | 13·42 | 0·17 | 0·01 | 0·17 | 13·2 | 0·1 | 1·29 |
| MgO | 54 | 5·64 | 5·88 | 5·78 | 0·07 | 0·02 | 0·07 | 3·53 | 0·33 | 1·16 |
| CaO | 54 | 10·25 | 10·64 | 10·41 | 0·07 | 0·01 | 0·07 | 6·61 | 0·11 | 0·7 |
| Na2O | 54 | 2·61 | 2·77 | 2·69 | 0·06 | 0·02 | 0·05 | 3·6 | 0·56 | 2·02 |
| K2O | 54 | 0·4 | 0·43 | 0·42 | 0·01 | 0 | 0·01 | 2·29 | 0·53 | 1·22 |
| TiO2 | 54 | 2·6 | 2·82 | 2·75 | 0·04 | 0·01 | 0·04 | 6·33 | 0·25 | 1·61 |
| MnO | 54 | 0·22 | 0·23 | 0·22 | 0 | 0 | 0 | 0·29 | 1·47 | 0·43 |
| P2O5 | 54 | 0·26 | 0·31 | 0·29 | 0·02 | 0 | 0·02 | 8·75 | 0·68 | 5·92 |
| La | 42 | 12·62 | 14·27 | 13·53 | 0·37 | 0·21 | 0·31 | 1·48 | 1·53 | 2·26 |
| Ce | 42 | 31·73 | 35·71 | 33·9 | 0·9 | 0·53 | 0·72 | 1·35 | 1·58 | 2·14 |
| Pr | 42 | 4·46 | 5·02 | 4·78 | 0·13 | 0·07 | 0·11 | 1·69 | 1·39 | 2·34 |
| Nd | 42 | 21·03 | 23·75 | 22·48 | 0·6 | 0·44 | 0·41 | 0·94 | 1·95 | 1·82 |
| Sm | 42 | 5·65 | 6·39 | 6·07 | 0·16 | 0·11 | 0·11 | 1 | 1·86 | 1·86 |
| Eu | 42 | 1·84 | 2·07 | 1·97 | 0·05 | 0·03 | 0·04 | 1·22 | 1·61 | 1·97 |
| Gd | 42 | 6·39 | 7·24 | 6·85 | 0·18 | 0·1 | 0·15 | 1·61 | 1·39 | 2·23 |
| Tb | 42 | 1·05 | 1·18 | 1·12 | 0·03 | 0·02 | 0·02 | 0·89 | 2 | 1·78 |
| Dy | 42 | 6·35 | 7·26 | 6·85 | 0·18 | 0·13 | 0·13 | 1·01 | 1·84 | 1·87 |
| Ho | 42 | 1·26 | 1·43 | 1·35 | 0·04 | 0·02 | 0·03 | 1·63 | 1·55 | 2·53 |
| Er | 42 | 3·54 | 4·01 | 3·81 | 0·11 | 0·07 | 0·08 | 1·1 | 1·95 | 2·13 |
| Tm | 42 | 0·53 | 0·61 | 0·58 | 0·02 | 0·01 | 0·02 | 1·3 | 2·1 | 2·73 |
| Yb | 42 | 3·14 | 3·65 | 3·4 | 0·1 | 0·05 | 0·09 | 1·72 | 1·48 | 2·54 |
| Lu | 42 | 0·47 | 0·53 | 0·5 | 0·01 | 0·01 | 0·01 | 1·32 | 1·21 | 1·59 |
| Nb | 54 | 18·31 | 20·86 | 19·88 | 0·4 | 0·1 | 0·39 | 4·01 | 0·49 | 1·95 |
| Zr | 54 | 173·89 | 191·47 | 185·09 | 2·92 | 0·35 | 2·9 | 8·38 | 0·19 | 1·57 |
| Y | 54 | 38·84 | 42·45 | 41·08 | 0·64 | 0·18 | 0·61 | 3·48 | 0·43 | 1·49 |
| Sr | 54 | 228·34 | 240·16 | 234·21 | 2·61 | 0·35 | 2·58 | 7·44 | 0·15 | 1·1 |
| Rb | 54 | 7·56 | 8·21 | 7·83 | 0·14 | 0·17 | — | — | 2·2 | — |
| Zn | 54 | 111·15 | 140·14 | 125·46 | 6·35 | 0·97 | 6·28 | 6·46 | 0·78 | 5 |
| Cu | 54 | 94·75 | 121·73 | 100·03 | 5·29 | 0·64 | 5·25 | 8·15 | 0·64 | 5·25 |
| Ni | 54 | 35·02 | 46·68 | 39·38 | 2·6 | 0·55 | 2·54 | 4·65 | 1·39 | 6·46 |
| Cr | 54 | 50·13 | 75·39 | 58·06 | 5·33 | 0·77 | 5·27 | 6·82 | 1·33 | 9·08 |
| V | 54 | 345·9 | 424·08 | 387·27 | 16·08 | 2·24 | 15·93 | 7·13 | 0·58 | 4·11 |
| Ba | 54 | 83·62 | 94·48 | 89·44 | 2·1 | 3 | — | — | 3·36 | — |
| Sc | 54 | 39·18 | 47·11 | 42·36 | 2·1 | 0·72 | 1·97 | 2·72 | 1·71 | 4·64 |
| Zr/Y | 54 | 4·46 | 4·55 | 4·51 | 0·02 | 0·02 | — | — | 0·49 | — |
| Nb/Zr | 54 | 0·1 | 0·11 | 0·11 | 0 | 0 | 0 | 1·75 | 0·51 | 0·89 |
| La/Yb | 42 | 3·91 | 4·07 | 3·99 | 0·04 | 0·03 | 0·03 | 0·9 | 0·83 | 0·75 |
n, number of analyses.  , mean; σo, observed standard deviation from the mean for the whole sample set; σr, repeat standard deviation based on multiple repeat analyses of the same sample; σt, true standard deviation; P%, percentage precision (100 × σr/
 ); V%, percentage variability (100 × σt/
 ). Major element oxides are in wt %, all other elements are in ppm. Major and trace elements were measured by XRF spectrometry and REE were measured by ICP–MS. Italics indicates elements analysed where σr is greater than σo; these elements are not used in the conclusions drawn in this study. Values in bold have σt/σr ≥ 1·77.
Geochemical variability in whole-rock major and trace elements across the Laki lava flow
| n | Min. | Max. | | σo | σr | σt | σt/σr | P% | V% | |
|---|---|---|---|---|---|---|---|---|---|---|
| SiO2 | 54 | 49·99 | 50·45 | 50·28 | 0·1 | 0·03 | 0·09 | 2·79 | 0·06 | 0·18 |
| Al2O3 | 54 | 13·5 | 14·25 | 13·74 | 0·2 | 0·04 | 0·2 | 4·66 | 0·31 | 1·44 |
| FeOT | 54 | 12·88 | 13·7 | 13·42 | 0·17 | 0·01 | 0·17 | 13·2 | 0·1 | 1·29 |
| MgO | 54 | 5·64 | 5·88 | 5·78 | 0·07 | 0·02 | 0·07 | 3·53 | 0·33 | 1·16 |
| CaO | 54 | 10·25 | 10·64 | 10·41 | 0·07 | 0·01 | 0·07 | 6·61 | 0·11 | 0·7 |
| Na2O | 54 | 2·61 | 2·77 | 2·69 | 0·06 | 0·02 | 0·05 | 3·6 | 0·56 | 2·02 |
| K2O | 54 | 0·4 | 0·43 | 0·42 | 0·01 | 0 | 0·01 | 2·29 | 0·53 | 1·22 |
| TiO2 | 54 | 2·6 | 2·82 | 2·75 | 0·04 | 0·01 | 0·04 | 6·33 | 0·25 | 1·61 |
| MnO | 54 | 0·22 | 0·23 | 0·22 | 0 | 0 | 0 | 0·29 | 1·47 | 0·43 |
| P2O5 | 54 | 0·26 | 0·31 | 0·29 | 0·02 | 0 | 0·02 | 8·75 | 0·68 | 5·92 |
| La | 42 | 12·62 | 14·27 | 13·53 | 0·37 | 0·21 | 0·31 | 1·48 | 1·53 | 2·26 |
| Ce | 42 | 31·73 | 35·71 | 33·9 | 0·9 | 0·53 | 0·72 | 1·35 | 1·58 | 2·14 |
| Pr | 42 | 4·46 | 5·02 | 4·78 | 0·13 | 0·07 | 0·11 | 1·69 | 1·39 | 2·34 |
| Nd | 42 | 21·03 | 23·75 | 22·48 | 0·6 | 0·44 | 0·41 | 0·94 | 1·95 | 1·82 |
| Sm | 42 | 5·65 | 6·39 | 6·07 | 0·16 | 0·11 | 0·11 | 1 | 1·86 | 1·86 |
| Eu | 42 | 1·84 | 2·07 | 1·97 | 0·05 | 0·03 | 0·04 | 1·22 | 1·61 | 1·97 |
| Gd | 42 | 6·39 | 7·24 | 6·85 | 0·18 | 0·1 | 0·15 | 1·61 | 1·39 | 2·23 |
| Tb | 42 | 1·05 | 1·18 | 1·12 | 0·03 | 0·02 | 0·02 | 0·89 | 2 | 1·78 |
| Dy | 42 | 6·35 | 7·26 | 6·85 | 0·18 | 0·13 | 0·13 | 1·01 | 1·84 | 1·87 |
| Ho | 42 | 1·26 | 1·43 | 1·35 | 0·04 | 0·02 | 0·03 | 1·63 | 1·55 | 2·53 |
| Er | 42 | 3·54 | 4·01 | 3·81 | 0·11 | 0·07 | 0·08 | 1·1 | 1·95 | 2·13 |
| Tm | 42 | 0·53 | 0·61 | 0·58 | 0·02 | 0·01 | 0·02 | 1·3 | 2·1 | 2·73 |
| Yb | 42 | 3·14 | 3·65 | 3·4 | 0·1 | 0·05 | 0·09 | 1·72 | 1·48 | 2·54 |
| Lu | 42 | 0·47 | 0·53 | 0·5 | 0·01 | 0·01 | 0·01 | 1·32 | 1·21 | 1·59 |
| Nb | 54 | 18·31 | 20·86 | 19·88 | 0·4 | 0·1 | 0·39 | 4·01 | 0·49 | 1·95 |
| Zr | 54 | 173·89 | 191·47 | 185·09 | 2·92 | 0·35 | 2·9 | 8·38 | 0·19 | 1·57 |
| Y | 54 | 38·84 | 42·45 | 41·08 | 0·64 | 0·18 | 0·61 | 3·48 | 0·43 | 1·49 |
| Sr | 54 | 228·34 | 240·16 | 234·21 | 2·61 | 0·35 | 2·58 | 7·44 | 0·15 | 1·1 |
| Rb | 54 | 7·56 | 8·21 | 7·83 | 0·14 | 0·17 | — | — | 2·2 | — |
| Zn | 54 | 111·15 | 140·14 | 125·46 | 6·35 | 0·97 | 6·28 | 6·46 | 0·78 | 5 |
| Cu | 54 | 94·75 | 121·73 | 100·03 | 5·29 | 0·64 | 5·25 | 8·15 | 0·64 | 5·25 |
| Ni | 54 | 35·02 | 46·68 | 39·38 | 2·6 | 0·55 | 2·54 | 4·65 | 1·39 | 6·46 |
| Cr | 54 | 50·13 | 75·39 | 58·06 | 5·33 | 0·77 | 5·27 | 6·82 | 1·33 | 9·08 |
| V | 54 | 345·9 | 424·08 | 387·27 | 16·08 | 2·24 | 15·93 | 7·13 | 0·58 | 4·11 |
| Ba | 54 | 83·62 | 94·48 | 89·44 | 2·1 | 3 | — | — | 3·36 | — |
| Sc | 54 | 39·18 | 47·11 | 42·36 | 2·1 | 0·72 | 1·97 | 2·72 | 1·71 | 4·64 |
| Zr/Y | 54 | 4·46 | 4·55 | 4·51 | 0·02 | 0·02 | — | — | 0·49 | — |
| Nb/Zr | 54 | 0·1 | 0·11 | 0·11 | 0 | 0 | 0 | 1·75 | 0·51 | 0·89 |
| La/Yb | 42 | 3·91 | 4·07 | 3·99 | 0·04 | 0·03 | 0·03 | 0·9 | 0·83 | 0·75 |
n, number of analyses. , mean; σo, observed standard deviation from the mean for the whole sample set; σr, repeat standard deviation based on multiple repeat analyses of the same sample; σt, true standard deviation; P%, percentage precision (100 × σr/); V%, percentage variability (100 × σt/). Major element oxides are in wt %, all other elements are in ppm. Major and trace elements were measured by XRF spectrometry and REE were measured by ICP–MS. Italics indicates elements analysed where σr is greater than σo; these elements are not used in the conclusions drawn in this study. Values in bold have σt/σr ≥ 1·77.
Inductively coupled plasma mass spectrometry
All of the samples, apart from the 12 taken at the Eldvatnsbrú section, were prepared for analysis by inductively coupled plasma mass spectrometry (ICP-MS) at the Scottish Universities Environmental Research Centre (SUERC) where the concentrations of REE were measured according to the following method. Homogeneous powders of whole-rock samples were prepared for analysis by dissolving them using a tri-acid digestion involving HCl, HNO3 and HF. A small amount (0·1 ± 0·02 g) of dry powder from each of 35 lava and of seven tephra samples was weighed into a clean Teflon beaker. Approximately 5–10 ml of concentrated HF and 0·5 ml of 50% HNO3 (8 M) were added to each sample. Samples were then left on a hotplate to dissolve overnight in sealed beakers. The samples were dried the next day under heating lamps and 5 ml of 50% HNO3 (8 M) were added to each dry sample; the samples were left on a hotplate to dissolve overnight in sealed beakers. They were left to dry again the following morning under heating lamps and 1 ml of 50% HCl (6 M) was added to each dry sample, after which they were returned to the hotplate overnight in sealed beakers. The samples were dried the next day under heating lamps and then diluted in 5% HNO3 to bring the volume of the sample to 100 ml and bringing the concentration of the elements being analysed into the ppb range. These fluids were then decanted into clean plastic flasks. Diluted samples were spiked with 0·1 ml of three solutions each containing 1 ppm of a heavy indicator, In, Re, and Ru, which acted as internal standards. Basaltic standards BCR-1 and BIR-1 were prepared for analysis using the same method and at the same time as the unknowns, and have REE concentrations that bracket the range of REE concentrations in the unknowns. The samples were analysed for REE on a quadrupole ICP-MS system alongside the standards. Dilute HNO3 was aspirated between each analysis to avoid cross-contamination of the samples. Repeats on BCR-1 yield 1σ precisions better than 2% relative for all elements analysed. Accuracy is better than 10% for Tb and Tm, and better than 5% for all other elements analysed. Estimates of the true natural variation in the REE are also provided in Table 2.
Electron microprobe analysis
Major element and selected minor element concentrations of mineral phases (olivine, plagioclase and clinopyroxene), and tephra glass were measured using a CAMECA SX100 electron microprobe at the University of Edinburgh. Major element oxides were measured using five wavelength-dispersive spectrometers with counting times on single elements of between 10 and 30 s. Beam conditions of 15 keV accelerating voltage, 10 nA, and a spot size of 8 µm were used for glass analyses, and 15 keV and 10 nA for feldspar and 15 keV and 20 nA for olivine and clinopyroxene, both with a spot size of 5 µm. Analyses totaling >100·5 and <98% were rejected. Standard CAMECA PAP corrections were applied to these data. Precisions for repeat analyses on unknowns give an indication of instrument drift (Electronic Appendix 3). Precisions for repeat analyses on unknown olivine and St John’s Island olivine yield 1σ relative precision for molar forsterite content of better than 0·25%. Repeat measurements on standards such as wollastonite and jadeite yield relative (1σ) precisions better than 1% for SiO2, TiO2, and CaO, better than 2% for Al2O3, FeO, MgO and K2O, ∼3% for Na2O, ∼5% for NiO, and ∼10% for P2O5 and MnO. All the electron microprobe analysis data acquired from the Laki samples in this study are presented in Electronic Appendix 4.
COMPOSITIONAL HETEROGENEITY IN LAKI WHOLE-ROCK SAMPLES
Identification of natural signal above analytical noise
The true variation present in the sample set, σt, was recalculated using σt2 = σo2 − σr2 where σo is the standard deviation of the element in the observations from the Laki samples and σr is an estimate of the analytical noise (Table 2). The signal-to-noise ratio, σt/σr, is large when the variation in the sample population is large and the analytical error is small. The method described by Maclennan et al. (2003) was used to establish the probability that a given element is naturally variable. The value of σr, obtained from repeat measurements, is an estimate of the true analytical noise, σR. The quality of this estimate can be calculated using the χ2 distribution and the number of repeat observations used to calculate σr. This approach was used to calculate the value of σt/σr at which the null hypothesis, that σR ≥ σo , can be accepted. If the null hypothesis is true then there is no natural variability in the elements being examined. The number of repeat measurements, n, used to define σr is eight, hence the number of degrees of freedom is seven. The calculated value for σt/σr at which the null hypothesis can be accepted is ≤2·16 at the 99% confidence level, and ≤1·77 at the 95% confidence level. Conclusions in this study are therefore developed using only elements or element ratios where the signal-to-noise ratio is ≥1·77. These elements are highlighted in bold in Table 2, and many of the elements used for later modelling have extremely robust signal-to-noise ratios that are >5. A similar table for the electron microprobe analyses of the tephra glasses is shown in Table 3.
Geochemical variability in tephra glasses
| n | Min. | Max. |  | σo | σr | σt | σt/σr | P% | V% | |
|---|---|---|---|---|---|---|---|---|---|---|
| SiO2 | 30 | 47·95 | 49·77 | 48·95 | 0·39 | 0·37 | 0·11 | 0·29 | 0·76 | 0·22 |
| Al2O3 | 30 | 12·47 | 13·23 | 12·81 | 0·15 | 0·09 | 0·12 | 1·28 | 0·72 | 0·92 |
| FeOT | 30 | 13·84 | 15·16 | 14·23 | 0·32 | 0·19 | 0·26 | 1·32 | 1·37 | 1·8 |
| MgO | 30 | 5·28 | 5·7 | 5·54 | 0·1 | 0·09 | 0·05 | 0·59 | 1·59 | 0·93 |
| CaO | 30 | 9·32 | 9·77 | 9·63 | 0·1 | 0·07 | 0·07 | 1·03 | 0·69 | 0·71 |
| Na2O | 30 | 2·21 | 3·05 | 2·74 | 0·14 | 0·08 | 0·11 | 1·35 | 3·02 | 4·09 |
| K2O | 30 | 0·44 | 0·52 | 0·46 | 0·02 | 0·01 | 0·01 | 2·17 | 1·46 | 3·17 |
| TiO2 | 30 | 3·02 | 3·2 | 3·11 | 0·04 | 0·03 | 0·03 | 1·19 | 0·86 | 1·02 |
| MnO | 30 | 0·22 | 0·28 | 0·25 | 0·01 | 0·03 | — | — | 12·72 | — |
| P2O5 | 30 | 0·38 | 0·48 | 0·43 | 0·02 | 0·04 | — | — | 9·68 | — |
| n | Min. | Max. | | σo | σr | σt | σt/σr | P% | V% | |
|---|---|---|---|---|---|---|---|---|---|---|
| SiO2 | 30 | 47·95 | 49·77 | 48·95 | 0·39 | 0·37 | 0·11 | 0·29 | 0·76 | 0·22 |
| Al2O3 | 30 | 12·47 | 13·23 | 12·81 | 0·15 | 0·09 | 0·12 | 1·28 | 0·72 | 0·92 |
| FeOT | 30 | 13·84 | 15·16 | 14·23 | 0·32 | 0·19 | 0·26 | 1·32 | 1·37 | 1·8 |
| MgO | 30 | 5·28 | 5·7 | 5·54 | 0·1 | 0·09 | 0·05 | 0·59 | 1·59 | 0·93 |
| CaO | 30 | 9·32 | 9·77 | 9·63 | 0·1 | 0·07 | 0·07 | 1·03 | 0·69 | 0·71 |
| Na2O | 30 | 2·21 | 3·05 | 2·74 | 0·14 | 0·08 | 0·11 | 1·35 | 3·02 | 4·09 |
| K2O | 30 | 0·44 | 0·52 | 0·46 | 0·02 | 0·01 | 0·01 | 2·17 | 1·46 | 3·17 |
| TiO2 | 30 | 3·02 | 3·2 | 3·11 | 0·04 | 0·03 | 0·03 | 1·19 | 0·86 | 1·02 |
| MnO | 30 | 0·22 | 0·28 | 0·25 | 0·01 | 0·03 | — | — | 12·72 | — |
| P2O5 | 30 | 0·38 | 0·48 | 0·43 | 0·02 | 0·04 | — | — | 9·68 | — |
Column headings are the same as for Table 2. The σt/σr at which the variations are likely to be natural is lower for the electron probe analyses than for the whole-rock data because a larger number of repeat measurements were used to estimate σr. The 99% confidence level for natural variation being present in the dataset is therefore at σt/σr ≥ 1·02.
Geochemical variability in tephra glasses
| n | Min. | Max. | | σo | σr | σt | σt/σr | P% | V% | |
|---|---|---|---|---|---|---|---|---|---|---|
| SiO2 | 30 | 47·95 | 49·77 | 48·95 | 0·39 | 0·37 | 0·11 | 0·29 | 0·76 | 0·22 |
| Al2O3 | 30 | 12·47 | 13·23 | 12·81 | 0·15 | 0·09 | 0·12 | 1·28 | 0·72 | 0·92 |
| FeOT | 30 | 13·84 | 15·16 | 14·23 | 0·32 | 0·19 | 0·26 | 1·32 | 1·37 | 1·8 |
| MgO | 30 | 5·28 | 5·7 | 5·54 | 0·1 | 0·09 | 0·05 | 0·59 | 1·59 | 0·93 |
| CaO | 30 | 9·32 | 9·77 | 9·63 | 0·1 | 0·07 | 0·07 | 1·03 | 0·69 | 0·71 |
| Na2O | 30 | 2·21 | 3·05 | 2·74 | 0·14 | 0·08 | 0·11 | 1·35 | 3·02 | 4·09 |
| K2O | 30 | 0·44 | 0·52 | 0·46 | 0·02 | 0·01 | 0·01 | 2·17 | 1·46 | 3·17 |
| TiO2 | 30 | 3·02 | 3·2 | 3·11 | 0·04 | 0·03 | 0·03 | 1·19 | 0·86 | 1·02 |
| MnO | 30 | 0·22 | 0·28 | 0·25 | 0·01 | 0·03 | — | — | 12·72 | — |
| P2O5 | 30 | 0·38 | 0·48 | 0·43 | 0·02 | 0·04 | — | — | 9·68 | — |
Column headings are the same as for Table 2. The σt/σr at which the variations are likely to be natural is lower for the electron probe analyses than for the whole-rock data because a larger number of repeat measurements were used to estimate σr. The 99% confidence level for natural variation being present in the dataset is therefore at σt/σr ≥ 1·02.
Elemental correlations
Tables of correlation coefficients can also be used to assess the quality of the dataset, the likelihood of natural variation, and the processes that control the variation. Strong linear correlations are present within the dataset within and between major and trace element concentrations (Figs 6–8). As expected, elements with poor signal-to-noise ratios, such as Ba, tend to show low correlation coefficients with all elements. A full matrix of correlation coefficients is provided in Supplementary Data. Importantly, elements measured on different aliquots of the prepared material, for XRF and ICP-MS, show good correlations. Major elements analysed on glass discs for XRF, such as TiO2, and trace elements measured on powder discs, such as Zr, show very strong correlations. Internal correlations between the REE are also excellent, partly reflecting correlated natural variation. However, the maximum correlation coefficients of the REE with incompatible trace elements such as Zr are about 0·7, as expected from the relatively low signal-to-noise ratios of the REE as analysed by ICP-MS.
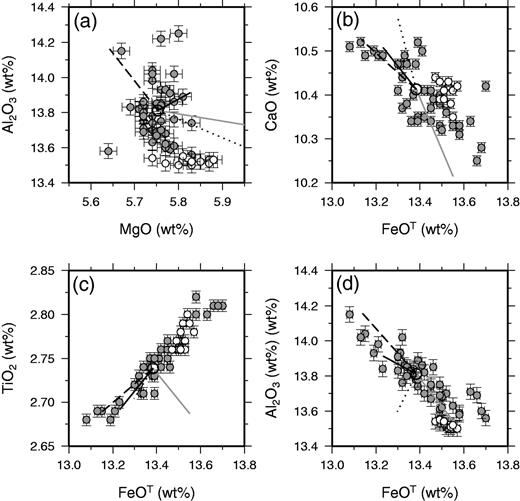
Major element variations within Laki whole-rock samples, shown as grey circles with 1σ errors, apart from the Eldvatnsbrú samples, which are plotted as unfilled circles. The large unfilled circle is the average whole-rock composition. The lines radiating from this circle show the effect of accumulating 2% by mass of plagioclase (dashed lines), clinopyroxene (dotted lines), olivine (grey lines) or the average phenocryst composition (continuous black line).
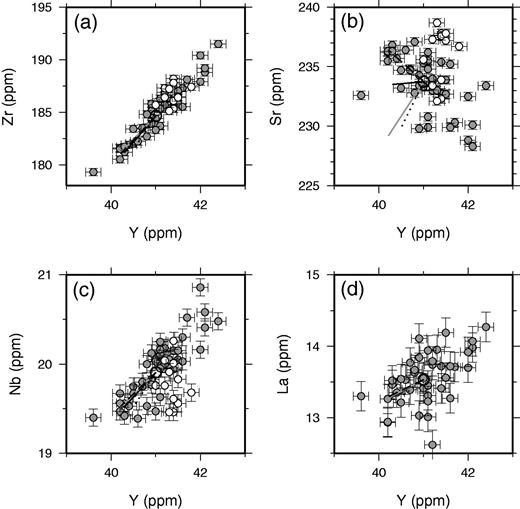
Trace element variations within Laki whole-rock samples. Symbols and lines are the same as for Fig. 6.
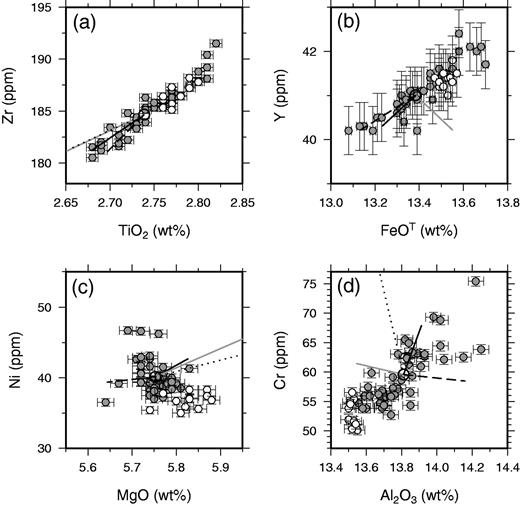
Trace element and major element interrelations within Laki whole-rock samples. Symbols and lines are the same as for Fig. 6.
PHENOCRYST CONTENTS AND WHOLE-ROCK COMPOSITIONS
Causes of compositional variation in Laki whole-rock samples
The inter-elemental correlations displayed in Figures 6–8 can, in many cases, be accounted for by variable addition or removal of the crystal phases found as phenocrysts in the whole-rock samples. The effect of modest amounts of crystal accumulation or fractional crystallization is illustrated in these figures, and only a few per cent by mass of crystal addition or removal can account for the full range of elemental compositions in many cases. Exceptions to this behaviour are displayed on plots of elements such as Nb against Y in Fig. 7, where one element is highly incompatible during mantle melting and the other is only moderately incompatible. This sort of scatter may indicate that some of the variation in Nb and Y derives from incomplete mixing of mantle melts. However, the signal-to-noise ratio of the variation in such elemental ratios is small, and it is clear that addition or removal of crystals in the crust dominates most of the variation in these variably incompatible lithophile elements. The poor, negative correlation between Ni and MgO (r = −0·44) demonstrated in Fig. 8c is not readily accounted for by the models of crystal addition illustrated in the figure. It is possible that a careful balance of olivine and plagioclase addition or removal could account for the negative slope shown in this plot, but such a model would not match the correlations observed between other elements. It is therefore possible that Ni concentrations are being controlled by removal of a phase that is not observed as a phenocryst in Laki, possibly magnetite or sulphides. Nevertheless, principal component analysis of the entire geochemical dataset confirms that about 65% of the compositional variance within the Laki whole-rock samples is accounted for by correlated variations of incompatible elements that are likely to reflect crystal addition or removal. The majority of the compositional variation in these samples can therefore be accounted for by the variable addition and removal of the crystals observed as phenocryst phases in Laki.
Crystal accumulation or mush addition?
Strong correlations are also present between the composition of the whole-rock samples and the mass fraction of phenocrysts counted in each specimen (Figs 9 and 10). Such correlations between whole-rock compositions and phenocryst content might be generated by variable accumulation of phenocrysts into a carrier liquid composition. However, it is immediately apparent from the plot in Fig. 9 that crystal accumulation alone cannot account for the correlations. For instance, the slope of the observed correlation for whole-rock Zr and mass fraction phenocrysts has a slope (black continuous line) that is four times shallower than that expected for crystal accumulation alone (grey dashed line). The grey dashed line in Fig. 9 was calculated by assuming variable addition of the average phenocryst assemblage with the average measured phase composition. When electron microprobe analyses were not available, partition coefficients from the literature were used to estimate the composition of the olivine, clinopyroxene and plagioclase crystals in equilibrium with a liquid with the same composition as the average whole-rock composition. The details of the partition coefficients used have a negligible effect on the conclusion that the whole-rock variation is not caused simply by crystal accumulation: mismatches of this type are present for almost all available elements, both major and trace elements.
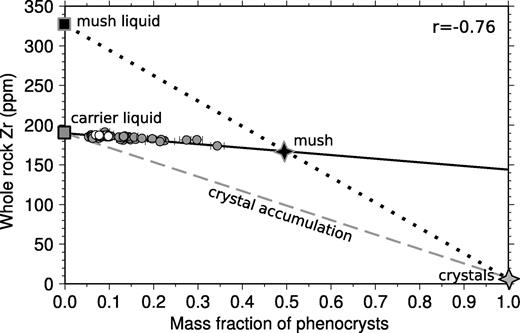
Relationship between mass fraction of phenocrysts and whole-rock Zr content shown as small filled circles. The black line shows the linear best fit to these observations, with the correlation coefficient shown in the top right corner. The dashed line shows the relationship between phenocryst content and whole-rock composition predicted from a crystal accumulation model, with mixing between a carrier liquid and the average phenocryst composition as estimated using suitable partition coefficients. This accumulation model does not fit the observations. Instead, variable addition of a mush, composed of an enriched liquid and solid can fit the observed linear trend. Suitable mush compositions can lie at any point on the continuous regression line extending from the samples to higher solid fractions.
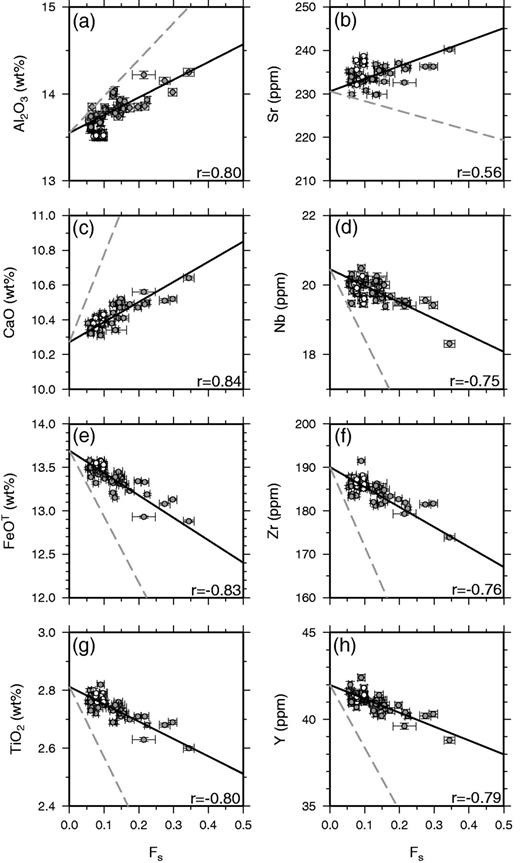
Linear regression fits to Laki whole-rock data against mass fraction (Fs) of phenocrysts, calculated using the subroutine FITEXY from Press et al. (1992) that includes errors in both x- and y-coordinates. The fits are shown as continuous black lines. The correlation coefficients for each element are shown as r. A full list of regression coefficients and fitting parameters with errors is provided in Supplementary Data. The grey dashed lines mark the expected relationship if the whole-rock variation was controlled by phenocryst accumulation alone, and are calculated by addition of the average phenocryst composition to the predicted carrier liquid composition. Some of the scatter for compatible elements such as Al results from variation in the relative proportions of different phenocryst types in the whole-rock samples.
An alternative mechanism for generating correlations between whole-rock composition and mass fraction of phenocrysts in samples is by variable addition of a melt–crystal mush to the crystal-free carrier liquid. This mush composition must lie on the extension of the black line in Fig. 9. An example of a possible mush liquid–solid compositional pair is shown in Fig. 9. There is a trade-off between liquid composition and solid fraction in the mush, and from the lever rule it follows that suitable mushes have high solid fractions when the Zr content of the mush liquid is high.
CONSTRAINING MUSH PROPERTIES FROM LAVA COMPOSITIONS
Mass-balance equations


Crystal compositions used in modelling
| Plagioclase | Clinopyroxene | Olivine | Bulk | |
|---|---|---|---|---|
| SiO2 | 47·63 | 50·74 | 38·35 | 47·60 |
| Al2O3 | 31·66 | 2·82 | 0·12 | 18·96 |
| FeO | 0·69 | 8·94 | 21·96 | 5·67 |
| MgO | 0·15 | 16·21 | 38·96 | 9·56 |
| CaO | 16·13 | 18·98 | 0·28 | 15·30 |
| Na2O | 2·36 | 0·28 | 0·02 | 1·44 |
| K2O | 0·05 | 0·00 | 0·00 | 0·03 |
| TiO2 | 0·03 | 0·98 | 0·09 | 0·34 |
| MnO | 0·01 | 0·24 | 0·33 | 0·12 |
| P2O5 | 0·02 | 0·01 | 0·00 | 0·01 |
| Nb | 0·40 | 0·10 | 0·08 | 0·27 |
| Zr | 0·35 | 18·47 | 5·35 | 6·70 |
| Y | 0·62 | 15·17 | 0·89 | 5·31 |
| Sr | 369·55 | 35·06 | 1·87 | 222·07 |
| Rb | 0·12 | 0·00 | 0·04 | 0·07 |
| Zn | 3·49 | 50·72 | 212·62 | 41·61 |
| Cu | 0·89 | 40·30 | 11·08 | 14·63 |
| Ni | 1·54 | 206·53 | 941·99 | 170·59 |
| Cr | 1·72 | 1461·24 | 153·18 | 485·43 |
| V | 3·30 | 780·21 | 39·01 | 255·84 |
| Ba | 15·53 | 0·27 | 0·24 | 8·97 |
| Sc | 0·18 | 55·72 | 11·89 | 19·24 |
| La | 1·06 | 0·95 | 0·20 | 0·93 |
| Ce | 2·07 | 3·39 | 0·40 | 2·31 |
| Pr | 0·40 | 0·72 | 0·05 | 0·46 |
| Nd | 1·44 | 4·50 | 0·17 | 2·28 |
| Sm | 0·25 | 1·76 | 0·03 | 0·71 |
| Eu | 2·10 | 0·63 | 0·02 | 1·40 |
| Gd | 0·07 | 2·40 | 0·04 | 0·81 |
| Tb | 0·03 | 0·41 | 0·02 | 0·15 |
| Dy | 0·08 | 2·54 | 0·10 | 0·87 |
| Ho | 0·01 | 0·50 | 0·03 | 0·17 |
| Er | 0·03 | 1·37 | 0·12 | 0·47 |
| Tm | 0·00 | 0·20 | 0·02 | 0·07 |
| Yb | 0·03 | 1·12 | 0·14 | 0·39 |
| Lu | 0·00 | 0·16 | 0·04 | 0·06 |
Major element oxides are in wt %, all other elements are in ppm. Italics show compositions that were calculated from partition coefficients as described in the text.

 against
  where the intercept is equal to the carrier liquid composition, Ccl, and the slope is given by
Observed and model liquid compositions
 |  |  | Ccl | Cml@0·5 | Cml@0·6 | |
|---|---|---|---|---|---|---|
| SiO2 | 50·26 | 50·13 | 48·95 | 50·36 ± 0·22 | 52·21 ± 1·80 | 51·60 ± 1·23 |
| Al2O3 | 13·81 | 13·64 | 12·81 | 13·96 ± 0·09 | 8·49 ± 0·77 | 10·29 ± 0·53 |
| FeO | 13·38 | 13·67 | 14·23 | 13·50 ± 0·04 | 20·25 ± 0·31 | 18·03 ± 0·21 |
| MgO | 5·75 | 5·76 | 5·54 | 5·46 ± 0·06 | 3·37 ± 0·49 | 4·06 ± 0·34 |
| CaO | 10·41 | 10·32 | 9·63 | 10·41 ± 0·07 | 5·51 ± 0·60 | 7·12 ± 0·41 |
| Na2O | 2·70 | 2·72 | 2·74 | 2·75 ± 0·01 | 3·76 ± 0·08 | 3·43 ± 0·05 |
| K2O | 0·42 | 0·42 | 0·46 | 0·43 ± 0·00 | 0·76 ± 0·01 | 0·65 ± 0·00 |
| TiO2 | 2·74 | 2·81 | 3·11 | 2·81 ± 0·00 | 4·70 ± 0·04 | 4·08 ± 0·03 |
| MnO | 0·22 | 0·23 | 0·25 | 0·23 ± 0·00 | 0·30 ± 0·01 | 0·28 ± 0·01 |
| P2O5 | 0·30 | 0·31 | 0·43 | 0·30 ± 0·00 | 0·54 ± 0·01 | 0·46 ± 0·00 |
| Nb | 19·91 | 20·59 | — | 20·46 ± 0·04 | 35·91 ± 0·30 | 30·83 ± 0·20 |
| Zr | 184·66 | 189·13 | — | 189·79 ± 0·25 | 329·23 ± 2·02 | 283·37 ± 1·38 |
| Y | 41·00 | 41·98 | — | 41·92 ± 0·09 | 70·73 ± 0·67 | 61·25 ± 0·46 |
| Sr | 233·74 | 229·38 | — | 236·53 ± 1·06 | 242·52 ± 8·94 | 240·55 ± 6·09 |
| Rb | 7·84 | 7·95 | — | 7·98 ± 0·06 | 14·77 ± 0·43 | 12·54 ± 0·29 |
| Zn | 126·80 | 137·83 | — | 130·85 ± 0·58 | 176·05 ± 4·59 | 161·19 ± 3·13 |
| Cu | 100·75 | 101·95 | — | 111·50 ± 0·74 | 106·99 ± 6·51 | 108·47 ± 4·43 |
| Ni | 40·13 | 41·85 | — | 33·86 ± 1·10 | — | — |
| Cr | 59·58 | 55·25 | — | 49·61 ± 3·67 | — | — |
| V | 390·11 | 419·58 | — | 402·69 ± 2·44 | 386·69 ± 19·05 | 391·95 ± 13·01 |
| Ba | 89·77 | 89·23 | — | 90·88 ± 1·08 | 165·51 ± 7·56 | 140·96 ± 5·19 |
| Sc | 42·85 | 46·58 | — | 44·06 ± 0·31 | 54·39 ± 2·34 | 50·99 ± 1·60 |
| La | 13·53 | 13·92 | — | 13·81 ± 0·08 | 24·36 ± 0·54 | 20·89 ± 0·37 |
| Ce | 33·90 | 34·82 | — | 34·56 ± 0·20 | 61·18 ± 1·40 | 52·43 ± 0·96 |
| Pr | 4·78 | 4·92 | — | 4·88 ± 0·02 | 8·45 ± 0·18 | 7·27 ± 0·12 |
| Nd | 22·48 | 23·07 | — | 22·93 ± 0·16 | 39·73 ± 1·13 | 34·21 ± 0·78 |
| Sm | 6·07 | 6·23 | — | 6·18 ± 0·04 | 10·67 ± 0·29 | 9·19 ± 0·20 |
| Eu | 1·97 | 2·02 | — | 2·04 ± 0·01 | 2·14 ± 0·11 | 2·11 ± 0·08 |
| Gd | 6·85 | 7·01 | — | 6·99 ± 0·04 | 11·95 ± 0·26 | 10·32 ± 0·18 |
| Tb | 1·12 | 1·15 | — | 1·14 ± 0·01 | 1·93 ± 0·06 | 1·67 ± 0·04 |
| Dy | 6·85 | 7·05 | — | 6·97 ± 0·05 | 12·01 ± 0·33 | 10·35 ± 0·23 |
| Ho | 1·35 | 1·39 | — | 1·37 ± 0·01 | 2·36 ± 0·06 | 2·03 ± 0·04 |
| Er | 3·81 | 3·92 | — | 3·88 ± 0·03 | 6·65 ± 0·19 | 5·74 ± 0·13 |
| Tm | 0·58 | 0·59 | — | 0·59 ± 0·00 | 0·99 ± 0·03 | 0·86 ± 0·02 |
| Yb | 3·40 | 3·50 | — | 3·47 ± 0·02 | 5·92 ± 0·14 | 5·11 ± 0·09 |
| Lu | 0·50 | 0·52 | — | 0·51 ± 0·00 | 0·87 ± 0·02 | 0·75 ± 0·01 |
| | | Ccl | Cml@0·5 | Cml@0·6 | |
|---|---|---|---|---|---|---|
| SiO2 | 50·26 | 50·13 | 48·95 | 50·36 ± 0·22 | 52·21 ± 1·80 | 51·60 ± 1·23 |
| Al2O3 | 13·81 | 13·64 | 12·81 | 13·96 ± 0·09 | 8·49 ± 0·77 | 10·29 ± 0·53 |
| FeO | 13·38 | 13·67 | 14·23 | 13·50 ± 0·04 | 20·25 ± 0·31 | 18·03 ± 0·21 |
| MgO | 5·75 | 5·76 | 5·54 | 5·46 ± 0·06 | 3·37 ± 0·49 | 4·06 ± 0·34 |
| CaO | 10·41 | 10·32 | 9·63 | 10·41 ± 0·07 | 5·51 ± 0·60 | 7·12 ± 0·41 |
| Na2O | 2·70 | 2·72 | 2·74 | 2·75 ± 0·01 | 3·76 ± 0·08 | 3·43 ± 0·05 |
| K2O | 0·42 | 0·42 | 0·46 | 0·43 ± 0·00 | 0·76 ± 0·01 | 0·65 ± 0·00 |
| TiO2 | 2·74 | 2·81 | 3·11 | 2·81 ± 0·00 | 4·70 ± 0·04 | 4·08 ± 0·03 |
| MnO | 0·22 | 0·23 | 0·25 | 0·23 ± 0·00 | 0·30 ± 0·01 | 0·28 ± 0·01 |
| P2O5 | 0·30 | 0·31 | 0·43 | 0·30 ± 0·00 | 0·54 ± 0·01 | 0·46 ± 0·00 |
| Nb | 19·91 | 20·59 | — | 20·46 ± 0·04 | 35·91 ± 0·30 | 30·83 ± 0·20 |
| Zr | 184·66 | 189·13 | — | 189·79 ± 0·25 | 329·23 ± 2·02 | 283·37 ± 1·38 |
| Y | 41·00 | 41·98 | — | 41·92 ± 0·09 | 70·73 ± 0·67 | 61·25 ± 0·46 |
| Sr | 233·74 | 229·38 | — | 236·53 ± 1·06 | 242·52 ± 8·94 | 240·55 ± 6·09 |
| Rb | 7·84 | 7·95 | — | 7·98 ± 0·06 | 14·77 ± 0·43 | 12·54 ± 0·29 |
| Zn | 126·80 | 137·83 | — | 130·85 ± 0·58 | 176·05 ± 4·59 | 161·19 ± 3·13 |
| Cu | 100·75 | 101·95 | — | 111·50 ± 0·74 | 106·99 ± 6·51 | 108·47 ± 4·43 |
| Ni | 40·13 | 41·85 | — | 33·86 ± 1·10 | — | — |
| Cr | 59·58 | 55·25 | — | 49·61 ± 3·67 | — | — |
| V | 390·11 | 419·58 | — | 402·69 ± 2·44 | 386·69 ± 19·05 | 391·95 ± 13·01 |
| Ba | 89·77 | 89·23 | — | 90·88 ± 1·08 | 165·51 ± 7·56 | 140·96 ± 5·19 |
| Sc | 42·85 | 46·58 | — | 44·06 ± 0·31 | 54·39 ± 2·34 | 50·99 ± 1·60 |
| La | 13·53 | 13·92 | — | 13·81 ± 0·08 | 24·36 ± 0·54 | 20·89 ± 0·37 |
| Ce | 33·90 | 34·82 | — | 34·56 ± 0·20 | 61·18 ± 1·40 | 52·43 ± 0·96 |
| Pr | 4·78 | 4·92 | — | 4·88 ± 0·02 | 8·45 ± 0·18 | 7·27 ± 0·12 |
| Nd | 22·48 | 23·07 | — | 22·93 ± 0·16 | 39·73 ± 1·13 | 34·21 ± 0·78 |
| Sm | 6·07 | 6·23 | — | 6·18 ± 0·04 | 10·67 ± 0·29 | 9·19 ± 0·20 |
| Eu | 1·97 | 2·02 | — | 2·04 ± 0·01 | 2·14 ± 0·11 | 2·11 ± 0·08 |
| Gd | 6·85 | 7·01 | — | 6·99 ± 0·04 | 11·95 ± 0·26 | 10·32 ± 0·18 |
| Tb | 1·12 | 1·15 | — | 1·14 ± 0·01 | 1·93 ± 0·06 | 1·67 ± 0·04 |
| Dy | 6·85 | 7·05 | — | 6·97 ± 0·05 | 12·01 ± 0·33 | 10·35 ± 0·23 |
| Ho | 1·35 | 1·39 | — | 1·37 ± 0·01 | 2·36 ± 0·06 | 2·03 ± 0·04 |
| Er | 3·81 | 3·92 | — | 3·88 ± 0·03 | 6·65 ± 0·19 | 5·74 ± 0·13 |
| Tm | 0·58 | 0·59 | — | 0·59 ± 0·00 | 0·99 ± 0·03 | 0·86 ± 0·02 |
| Yb | 3·40 | 3·50 | — | 3·47 ± 0·02 | 5·92 ± 0·14 | 5·11 ± 0·09 |
| Lu | 0·50 | 0·52 | — | 0·51 ± 0·00 | 0·87 ± 0·02 | 0·75 ± 0·01 |
The observed average Laki whole-rock composition is given as  with a 1σ standard deviation. The observed average tephra whole-rock composition is
  and the observed average tephra glass composition from this work is
  . The predicted carrier liquid composition, Ccl was calculated as described in the text and quoted with 1σ error estimates. The predicted mush liquid composition in a mush containing 50% liquid is shown as Cml@0·5 and that at 60% liquid as Cml@0·6.
Observed and model liquid compositions
| | | Ccl | Cml@0·5 | Cml@0·6 | |
|---|---|---|---|---|---|---|
| SiO2 | 50·26 | 50·13 | 48·95 | 50·36 ± 0·22 | 52·21 ± 1·80 | 51·60 ± 1·23 |
| Al2O3 | 13·81 | 13·64 | 12·81 | 13·96 ± 0·09 | 8·49 ± 0·77 | 10·29 ± 0·53 |
| FeO | 13·38 | 13·67 | 14·23 | 13·50 ± 0·04 | 20·25 ± 0·31 | 18·03 ± 0·21 |
| MgO | 5·75 | 5·76 | 5·54 | 5·46 ± 0·06 | 3·37 ± 0·49 | 4·06 ± 0·34 |
| CaO | 10·41 | 10·32 | 9·63 | 10·41 ± 0·07 | 5·51 ± 0·60 | 7·12 ± 0·41 |
| Na2O | 2·70 | 2·72 | 2·74 | 2·75 ± 0·01 | 3·76 ± 0·08 | 3·43 ± 0·05 |
| K2O | 0·42 | 0·42 | 0·46 | 0·43 ± 0·00 | 0·76 ± 0·01 | 0·65 ± 0·00 |
| TiO2 | 2·74 | 2·81 | 3·11 | 2·81 ± 0·00 | 4·70 ± 0·04 | 4·08 ± 0·03 |
| MnO | 0·22 | 0·23 | 0·25 | 0·23 ± 0·00 | 0·30 ± 0·01 | 0·28 ± 0·01 |
| P2O5 | 0·30 | 0·31 | 0·43 | 0·30 ± 0·00 | 0·54 ± 0·01 | 0·46 ± 0·00 |
| Nb | 19·91 | 20·59 | — | 20·46 ± 0·04 | 35·91 ± 0·30 | 30·83 ± 0·20 |
| Zr | 184·66 | 189·13 | — | 189·79 ± 0·25 | 329·23 ± 2·02 | 283·37 ± 1·38 |
| Y | 41·00 | 41·98 | — | 41·92 ± 0·09 | 70·73 ± 0·67 | 61·25 ± 0·46 |
| Sr | 233·74 | 229·38 | — | 236·53 ± 1·06 | 242·52 ± 8·94 | 240·55 ± 6·09 |
| Rb | 7·84 | 7·95 | — | 7·98 ± 0·06 | 14·77 ± 0·43 | 12·54 ± 0·29 |
| Zn | 126·80 | 137·83 | — | 130·85 ± 0·58 | 176·05 ± 4·59 | 161·19 ± 3·13 |
| Cu | 100·75 | 101·95 | — | 111·50 ± 0·74 | 106·99 ± 6·51 | 108·47 ± 4·43 |
| Ni | 40·13 | 41·85 | — | 33·86 ± 1·10 | — | — |
| Cr | 59·58 | 55·25 | — | 49·61 ± 3·67 | — | — |
| V | 390·11 | 419·58 | — | 402·69 ± 2·44 | 386·69 ± 19·05 | 391·95 ± 13·01 |
| Ba | 89·77 | 89·23 | — | 90·88 ± 1·08 | 165·51 ± 7·56 | 140·96 ± 5·19 |
| Sc | 42·85 | 46·58 | — | 44·06 ± 0·31 | 54·39 ± 2·34 | 50·99 ± 1·60 |
| La | 13·53 | 13·92 | — | 13·81 ± 0·08 | 24·36 ± 0·54 | 20·89 ± 0·37 |
| Ce | 33·90 | 34·82 | — | 34·56 ± 0·20 | 61·18 ± 1·40 | 52·43 ± 0·96 |
| Pr | 4·78 | 4·92 | — | 4·88 ± 0·02 | 8·45 ± 0·18 | 7·27 ± 0·12 |
| Nd | 22·48 | 23·07 | — | 22·93 ± 0·16 | 39·73 ± 1·13 | 34·21 ± 0·78 |
| Sm | 6·07 | 6·23 | — | 6·18 ± 0·04 | 10·67 ± 0·29 | 9·19 ± 0·20 |
| Eu | 1·97 | 2·02 | — | 2·04 ± 0·01 | 2·14 ± 0·11 | 2·11 ± 0·08 |
| Gd | 6·85 | 7·01 | — | 6·99 ± 0·04 | 11·95 ± 0·26 | 10·32 ± 0·18 |
| Tb | 1·12 | 1·15 | — | 1·14 ± 0·01 | 1·93 ± 0·06 | 1·67 ± 0·04 |
| Dy | 6·85 | 7·05 | — | 6·97 ± 0·05 | 12·01 ± 0·33 | 10·35 ± 0·23 |
| Ho | 1·35 | 1·39 | — | 1·37 ± 0·01 | 2·36 ± 0·06 | 2·03 ± 0·04 |
| Er | 3·81 | 3·92 | — | 3·88 ± 0·03 | 6·65 ± 0·19 | 5·74 ± 0·13 |
| Tm | 0·58 | 0·59 | — | 0·59 ± 0·00 | 0·99 ± 0·03 | 0·86 ± 0·02 |
| Yb | 3·40 | 3·50 | — | 3·47 ± 0·02 | 5·92 ± 0·14 | 5·11 ± 0·09 |
| Lu | 0·50 | 0·52 | — | 0·51 ± 0·00 | 0·87 ± 0·02 | 0·75 ± 0·01 |
The observed average Laki whole-rock composition is given as with a 1σ standard deviation. The observed average tephra whole-rock composition is and the observed average tephra glass composition from this work is . The predicted carrier liquid composition, Ccl was calculated as described in the text and quoted with 1σ error estimates. The predicted mush liquid composition in a mush containing 50% liquid is shown as Cml@0·5 and that at 60% liquid as Cml@0·6.
Results
The results of the regression modelling are shown in Figs 10 and 11 and Table 5. A range of possible mush melt compositions calculated as a function of the mush melt fraction is shown in Fig. 12. To better constrain the melt fraction in the mush, it is necessary to have further constraints on the likely composition of the mush melt. Such constraints can be obtained from the compositional profiles present in the Laki phenocrysts and from the overall compositional systematics of melts from the Eastern Volcanic Zone of Iceland. The TiO2 content of the plagioclase reaches an observed maximum of 0·13 wt % in crystal rims, whereas the lowest value found in crystal cores is less than 0·01 wt %. If equation (12c) of Bédard (2006) is used, which parameterizes DTi as a function of ln(MgO) of the melt, the predicted partition coefficient is close to 0·045, indicating that liquids with 2·9 wt % or more TiO2 were present during the growth of the plagioclase. The systematics of TiO2 during evolution of tholeiitic magmas are strongly controlled by the appearance of magnetite as a liquidus phase, such that the melt TiO2 reaches a maximum just prior to magnetite saturation (Carmichael, 1964; Humphreys, 2009). The highest TiO2 contents found in samples from the Eastern Volcanic Zone are associated with the Katla central volcano and are ∼5 wt % TiO2 at an MgO content of ∼5 wt % (Jakobsson et al., 2008).
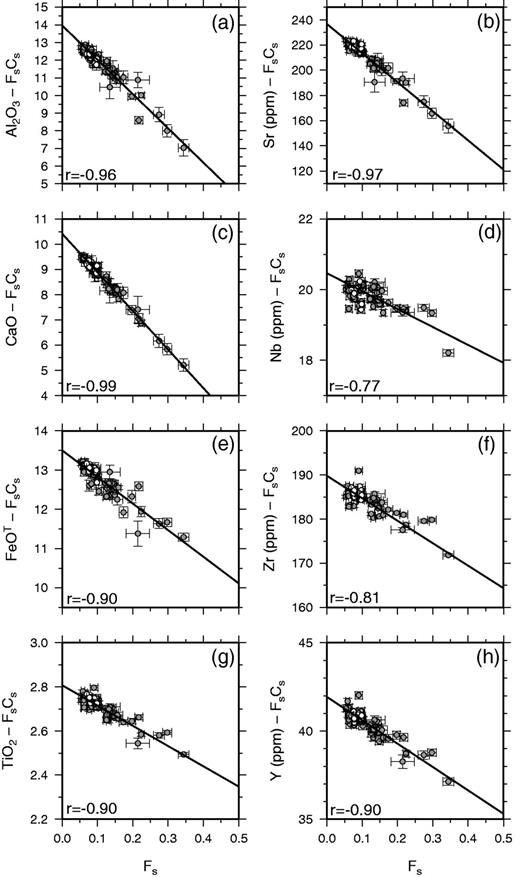
Linear regression fits to Laki whole-rock data against total mass fraction (Fs) of phenocrysts, with compositions corrected for the influence of accumulated crystals as described in the text. These regression fits can be used to solve equation (5). The correlation coefficients for each element are shown as r. A full list of regression coefficients and fitting parameters with errors is provided in Supplementary Data. The strong correlation partly reflects the presence of the Fs term on both sides of equation (5).
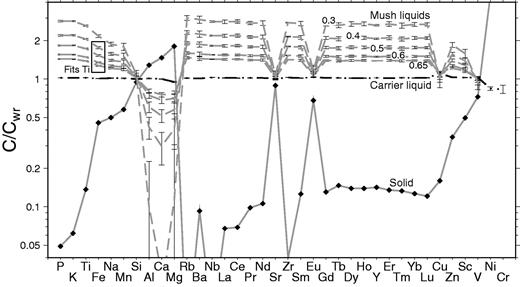
Predicted melt trace element compositions from modelling, normalized to the average Laki whole-rock sample from this study. The continuous grey line with black diamonds is the mush solid composition obtained from the average of the phenocryst compositions found in the Laki samples. The black dot–dash line shows the calculated Laki carrier liquid composition, with 1σ errors calculated as described in the text. The grey dashed lines show mush melt compositions calculated at mush melt fractions of 65, 60, 50, 40 and 30%. The box labelled ‘Fits Ti’ indicates mush melt compositions that are potentially in equilibrium with the observed range of plagioclase phenocrysts for Ti (over 50% melt), and have Ti contents within the range observed for Icelandic magmas.
However, this elevated Ti content in the Katla system samples is likely in part to reflect high Ti in the mantle melts feeding that volcanic system. Whole-rock samples and crystal-poor glasses from the Grímsvötn system, which are likely to have similar parental melts to the Laki eruption, do not exceed ∼4·3 wt % TiO2 near their point of magnetite saturation. Glassy selvages from lava samples and interstitial glasses in rootless cone tephra samples from Laki show a maximum of ∼4·3 wt % TiO2 when their groundmass crystallinity is ∼50% (Thordarson et al., 1996). The reasoning above indicates that, if the Laki mush liquid follows a similar evolutionary path to other Grímsvötn magmas, then it must have a TiO2 content of less than about 4·5 wt %. The results of the fitting model described above demonstrate that when the predicted mush melt has ∼4·5 wt % TiO2 the mush melt fraction, fml, is 0·55. When the predicted mush melt has ∼5·0 wt % TiO2, like the most Ti-rich samples from Katla, fml is 0·46. It is therefore likely that the fraction of melt in the mush is high, greater than 0·5, and may be as high as 0·65, corresponding to the properties of the most phenocryst-rich sample from Laki, LAK27. These constraints are also consistent with observations of the forsterite content of the rims of olivines in glassy samples, which indicate that such olivines were never in equilibrium with the extremely low Mg# melts predicted for mush liquids with fml of less than 0·5.
Therefore, in Fig. 12 and Table 5, the favoured estimate of the mush liquid composition is that corresponding to fml = 0·6, a mush porosity of 60%. This value was chosen to match the porosity at which the mush liquid would have a TiO2 content similar to that of the most titanian melt from the Grímsvötn system. It should be noted, in particular, that the predicted mush liquid compositions provided in Table 5 are iron rich and, according to the scheme of Frost & Frost (2008), can be classified as ferrobasalts. These high-density liquids can form during crystallization of tholeiitic liquids, just prior to the arrival of magnetite as a liquidus phase.
The relationship between the whole-rock compositions and phenocryst contents therefore not only indicates that incomplete mixing of a magmatic mush and carrier melt occurred prior to eruption at Laki, but also that the mush itself was more than 50% liquid at the time of entrainment. The least phenocryst-rich samples, such as the magmatic tephra with ∼5% phenocrysts, will therefore be composed of a mixture of 10% mush and 90% carrier liquid, whereas the most porphyritic lava samples may contain >70% disaggregated mush.
The extended trace element patterns in Fig. 12 also show that the predicted mush liquid compositions have similar patterns to those observed for the Laki whole-rock samples, but uniformly offset to higher concentrations for incompatible elements. Trace element ratios in the predicted mush liquids, such as Zr/Y and La/Yb, vary by less than 1% relative when 0·5 < fml < 0·65. Furthermore, the predicted mush liquids have very similar Zr/Y and La/Yb to Laki whole-rock samples, with the mush melts having Zr/Y and La/Yb that are only 2% higher than the mean analysed whole-rock sample. These findings indicate first that the variable accumulation of the mush into the Laki carrier liquid will have little influence on the incompatible trace element ratios of the magma and second that the mush liquid can be derived from melts similar to the Laki carrier by simple fractional crystallization. The compositions of other recent eruptions associated with the Grímsvötn volcanic system, such as the ad 1922, 1934, 1983 and 1998 eruptions from the Grímsvötn caldera and the 1996 eruption from the Gjálp fissure, also have Zr/Y close to 4·5, very similar to Laki and the predicted Laki mush melt, but distinct from eruptions associated with other nearby volcanic systems such as Bárdarbunga, Veiðivötn (Zr/Y ∼3·2) and Katla (Zr/Y >6) as demonstrated by Sigmarsson et al. (2000), Steinthorsson et al. (2000) and Lacasse et al. (2007). Although recent high-precision XRF analyses of the 1998 and 2004 eruption products of the Grímsvötn system reveal a statistically significant spread in Zr/Y of 4·8–5·3 (Jude-Eton & Thordarson, 2010), the variation within this system is less than the variation between systems. The similarity of the Zr/Y of the predicted Laki mush melt to that of other eruptions from the Grímsvötn system indicates that the mush melt may have been derived by simple fractional crystallization from melts typical of the Grímsvötn volcanic system.
The overall similarity of the predicted Laki carrier melt to the compositions of Grímsvötn central eruptions of the last 300 years is demonstrated in Fig. 13. The incompatible element concentrations of the predicted mush liquids are similar to those of the Gjálp eruption when fml is between 0·4 and 0·5. However, the Gjálp samples have a significantly lower Ti content than these predicted mush liquids, indicating that Gjálp melts have lost magnetite by fractional crystallization and are therefore more evolved than the predicted Laki mush melts. Because magmatic evolution in the crust fringing the Grímsvötn system is able to generate the Gjálp melts, it is plausible that such magmatic processes could also produce a melt similar to the calculated mush liquid.
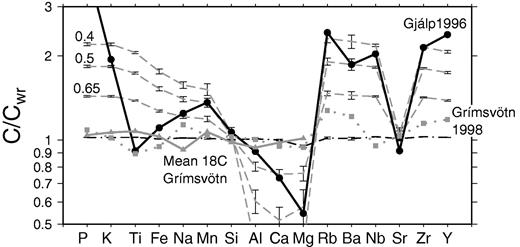
Comparison of the normalized trace element compositions of model predicted liquids with observed erupted tephra compositions from the Grímsvötn volcanic system. Normalization as in Fig. 12. The predicted Laki carrier liquid is shown as a dot–dash black line and the predicted mush liquids are plotted as dashed grey lines labelled with the mush melt fraction. The Gjálp 1996 erupted composition is shown as a black line with black circles and the Grimsvötn 1998 eruption as a grey dotted line with squares: these compositions are from Sigmarsson et al. (2000) and Steinthorsson et al. (2000). The continuous grey line with triangles shows the mean major element composition of tephra from 18th century eruptions of Grímsvötn, including the ad 1711, 1769, 1774 and 1784 compositions from Steinthorsson (1978).
TEMPORAL VARIATION IN THE LAKI CRYSTAL CARGO
The Laki whole-rock samples provide a record of variation in the crystal content during the eruption. The data presented in Fig. 14b show that the mass fraction of phenocrysts present in lava samples erupted from fissure segments 6–10 (opened 29 July to 24 October 1783) is significantly higher than in those from fissure segments 1–5 (opened 8 June to 9 July 1783). These differences in phenocryst content are present for samples collected both close to (<5 km) and far from the vents and therefore provide a robust record of changes in the characteristics of the erupted material. The average composition of the phenocrysts also differs between the samples erupted from the early fissures (1–5) and those erupted from the later fissures (6–10). The average plagioclase core compositions plotted in Fig. 14c show a significant rise in anorthite content from a mean XAn of 64·9 mol % in fissures 1–5 to 78·8 mol % in fissures 6–10. Similarly, the mean forsterite content measured in olivine phenocryst core composition rises from 73·8 mol % to 79·5 mol % from fissure 1–5 to fissures 6–10 and the Mg# of clinopyroxene cores rises from 76·5 to 78·0. Kolmogorov–Smirnov tests were used to examine the null hypothesis that the phenocrysts in samples from fissure segments 1–5 and fissure segments 6–10 were drawn from the same underlying compositional distribution. This null hypothesis could be rejected at the 99% level for clinopyroxene, olivine and plagioclase phenocrysts.
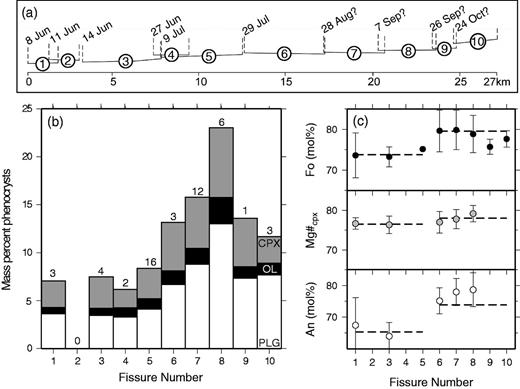
Temporal evolution of phenocryst contents and compositions in Laki whole-rock samples. (a) Plot showing the relationship between fissure number (numbers in circles), onset of fissure eruption dates in ad 1783, and total distance along the fissure row from a zero point at the extreme southwestern end. (b) Vertical bars showing average mass per cent of phenocrysts in whole-rock samples as a function of fissure number. The different shadings show the contributions of plagioclase (white), olivine (black) and clinopyroxene (grey) to the phenocryst mass. The total numbers of samples from each fissure, which were used to construct the averages, are shown at the top of each vertical bar. (c) Variations in phenocryst core compositions between fissures, showing the anorthite content of plagioclase in the bottom panel, the forsterite content of the olivine in the top panel and the Mg# of clinopyroxene in the middle panel. Circles show fissure means and fine vertical lines show ±1σ about the mean.
It is possible that the high phenocryst content of the samples sourced from the northeasterly, later opening fissures may be associated with a drop in magma discharge rate. It has been estimated that magma discharge rates dropped steadily during the first 5 months of activity. Notably, 60% of the total erupted magma volume emerged from fissure segments 1–5 between 8 June and 28 July. In contrast, only ∼30% of the total erupted volume was produced during the 3 months when fissure segments 6–10 formed (Thordarson & Self, 1993). These observations indicate that the average magma discharge rates dropped by a factor of ∼3 between the period of peak activity on fissure segments 1–5 and that of the activity related to fissure segments 6–10. One possibility, as may be seen from the description of magmatic properties presented below, is that the relatively high density and high viscosity of the phenocryst-rich lava produced in the later stages of the eruption may play a role in producing the drop in mass discharge rate.
DISCUSSION
Requirements of a successful model of mush formation and disaggregation
The observations and mass-balance calculations presented in the preceding sections provide constraints on the petrological and fluid dynamical processes that occur in the lead-up to the Laki eruption. Key results for the development and testing of fluid dynamical models are as follows. First, that the variation in Laki whole-rock compositions can be accounted for by incomplete binary mixing of a crystal–liquid mush and a basaltic liquid. Second, that the mush contains 50% or more liquid. Third, that the calculated mush liquid has a composition similar to that of a ferrobasalt. Fourth, that the relative proportions of the phenocrysts in the Laki samples are similar to those expected for low-pressure eutectic assemblages, indicating that no large-scale separation of different phases has occurred. A final important observation, which will be described in more detail below, is that the phenocrysts carried in the Laki samples are too primitive to have been the solid products of the crystallization interval that caused the liquid evolution from primitive basalt to iron-rich mush liquid. The temporal variation in crystal load and eruptive style during each fissure event and during the eruption as a whole should also inform models of the processes occurring in the Laki magmatic system.
Although simple fluid dynamical models have been powerful in understanding the behaviour of basaltic magmatic systems, it is now clear that the behaviour of crystals within magmatic liquids may be complex and that further laboratory experiments are required to investigate the range of fluid dynamical conditions present in magma chambers (Burgisser et al., 2005). A starting point for any modelling of this kind is knowledge of the likely physical properties of the magmatic phases involved in the system. These estimates are described in the following subsection, and then used to speculate upon the scope of fluid dynamical models that may be used to understand the Laki observations. Although it is clear that no single model uniquely accounts for the observations, the results can be used to rule out some simple models of mush generation and disaggregation as the origin of the relationship between whole-rock composition and phenocryst content observed in the products of the Laki eruption. The aim of this discussion is not, therefore, to provide a single fluid dynamical model, but rather to provide a focus for future fluid dynamical studies of particle-laden, variable viscosity fluids.
Physical properties of Laki mush and magma
The densities of mush and carrier liquids were predicted from the model of Lange & Carmichael (1990), as updated by Ochs & Lange (1999), both for anhydrous compositions and for water-bearing liquids. The water contents of the melts were estimated using the observed H2O/TiO2 in primitive Laki melt inclusions (Metrich et al., 1991) and the predicted TiO2 of the carrier and mush liquids (Tables 5 and 6) and therefore provide an upper bound on the water contents of these liquids because the assumption of constant H2O/TiO2 requires that no loss of H2O to a gas phase has taken place. The liquid viscosities were calculated using the method of Giordano et al. (2008). Water contents have an important effect on the physical properties of the melts, as demonstrated in Table 6. The pressure and temperature for the calculations were set at 2 kbar and 1150°C respectively. The pressure was estimated from the tephra glass composition using the parameterization of liquids multiply saturated in olivine, plagioclase and augite from Yang et al. (1996). This assumption is justifiable because many of the crystal rims in the tephra have compositions that are close to equilibrium with the tephra, implying multiple saturation (Guilbaud et al., 2007). The cores of the crystals are too primitive to be in equilibrium with their carrier, having crystallized from more mafic melts, possibly at greater depths (Guilbaud et al., 2007). Previous estimates of tephra liquidus temperature have been made by Guilbaud et al. (2007) at close to 1150°C, where the liquid was in equilibrium with Fo72 olivine, Mg# ∼73 clinopyroxene and An61 plagioclase. These liquidus temperatures are in agreement with those calculated for the carrier liquid using the PETROLOG software of Danyushevsky & Plechov (2011). Liquidus temperatures for the mush liquid at fml = 0·6 were estimated using the same method and were found to be slightly lower, about 1120°C, in equilibrium with Fo60 olivine, Mg# ∼61 clinopyroxene and An45 plagioclase. The estimates of the physical properties of the mush liquid presented in Table 6 are for 1150°C because during interaction of the mush and carrier melt the temperatures will equilibrate more rapidly than the compositions.
Predicted physical properties of Laki melts, crystals, mushes and magmas
| Material | Melt H2O (wt %) | ρ (kg m−3) | µ (Pa s) |
|---|---|---|---|
| Liquids | |||
| Carrier liquid (Ccl) | 0·00 | 2754 | 341 |
| Carrier liquid (Ccl) | 0·76 | 2698 | 94 |
| Dry mush liquid @ 60% liquid (Cml@0·6) | 0·00 | 2785 | 617 |
| Wet mush liquid @ 60% liquid (Cml@0·6) | 1·11 | 2703 | 72 |
| Crystals | |||
| Olivine Fo86 | — | 3289 | — |
| Olivine Fo71 | — | 3465 | — |
| Plagioclase An86 | — | 2641 | — |
| Plagioclase An78 | — | 2636 | — |
| Plagioclase An65 | — | 2614 | — |
| Clinopyroxene Mg# ∼81 | — | 3260 | — |
| Clinopyroxene Mg# ∼72 | — | 3310 | — |
| Cumulus phases | — | 2902 | — |
| Mixtures | |||
| Mush at 60% liquid | — | 2832 | 16591 |
| Mean Laki magma | — | 2721 | 135 |
Liquid properties are given both for anhydrous and water-bearing melts. All properties are calculated for a magmatic temperature of 1150°C. (See text for further details.)
Crystal densities at magmatic temperatures for olivine and clinopyroxene were taken from literature compilations of densities and thermal expansion coefficients (Fei, 1995; Smyth & McCormick, 1995). In the case of plagioclase, however, a more involved approach was taken because the Laki plagioclase phenocrysts have densities similar to those of the predicted liquids. The plagioclase compositions were selected from the collection of specimens whose molar volumes were determined by Angel et al. (1990) and thermal expansion behaviour was examined by Tribaudino et al. (2010). The corrections for thermal expansion were carried out using the implementation of the Holland & Powell (1998) parameterization as presented by Tribaudino et al. (2010). All the feldspar densities were less than those of the calculated magmatic liquids, by 57–171 kg m−3.
Mush properties are calculated assuming that the relative solid modal proportions are the same as for the average phenocryst proportions and using the magmatic viscosity model of Costa et al. (2009). In particular, the fit of this model to the experimental data of Lejeune & Richet (1995) was used to fix the constants required for the Costa et al. (2009) parameterization. The results of this modelling indicate that the mush viscosity is significantly higher than that of the average erupted Laki magma, which contains 12% phenocrysts (Table 6). Although the details of the mush viscosity are likely to depend upon strain rate, the compilation of experimental results presented by Costa et al. (2009) indicates that liquid–crystal mixtures containing 40% crystals are likely to have bulk viscosities at least an order of magnitude higher than that of their pure liquid.
Speculation on the origin of the mush
Variation in the composition of Laki whole-rock samples is dominated by mixing between a carrier melt composition and a liquid–crystal mush. The mush is composed of roughly equal proportions of solid and liquid, with the mush liquid being more evolved than the carrier liquid (Table 5). The similarity of the trace element patterns of the mush and carrier liquids in a normalized trace element plot (Fig. 12) indicates that the mush liquid can be derived from melts similar in composition to the carrier liquid by fractional crystallization. The relative enrichment of the incompatible trace elements in the mush liquid with respect to the carrier liquid can be accounted for by ∼33% fractional crystallization.
In situ liquid evolution in a cumulate pile?
The generation and evolution of magmatic mushes has been studied for layered intrusions such as Skaergaard (Wager, 1960; Humphreys, 2009; McKenzie, 2011). Many models of mush generation involve crystal settling onto the base of the magma chamber, followed by evolution of the interstitial liquid during the removal of porosity by crystallization and compaction. The evolution of interstitial liquids can generate a mush with normally zoned overgrowths on the primocrysts that originally formed the crystal framework (Humphreys, 2009). This mush of zoned crystals and evolved liquid can develop on the chamber margins and coexist with less evolved melts in the liquid-rich central parts of the chamber. It is tempting to account for the observations of variable mush accumulation in Laki with a mechanism whereby mush from the chamber margins was entrained into the open chamber and partially mixed into the carrier liquid before eruption.
However, the available phenocryst compositional data from this study (Fig. 14) and from previous workers (Guilbaud et al., 2007; Metrich et al., 1991) indicate that the Laki phenocrysts have crystallized from melts more primitive than, and probably parental to, the carrier. There is at present no good evidence available for the growth or overgrowth of these phenocrysts by crystallization from melts more evolved than the carrier liquid. The bulk of the Laki phenocrysts did not therefore form during the crystallization interval that corresponds to the evolution of basalts with a similar composition to that of the carrier liquid to the ferrobasaltic mush liquid composition. The juxtaposition of the crystals and ferrobasalt liquid of the mush must have taken place subsequent to the growth of the phenocrysts. This reasoning can therefore be used to discount the simple model of origin of the mush by static, in situ evolution of a cumulate pile.
Compositional convection in chamber margin mushes?
Ferrobasaltic liquid generated by the evolution of a primitive basaltic liquid has a different density from that of the original liquid. If the density differences are sufficiently large they may generate compositional convection within the mush (Kerr et al., 1989; Tait & Jaupart, 1992). At the onset of such convection, dense residual melts may be juxtaposed with more primitive crystals, potentially matching the observations. However, there is one crucial problem associated with the development of the calculated Laki mush by convection in a cumulate pile: the Laki phenocrysts occur in near-eutectic proportions of plagioclase, olivine and clinopyroxene, and magnetite is absent as a phenocryst phase. Over this crystallization interval the residual melts in the evolving system are denser than their parents and the liquid density profile is stable: no convection will occur on the chamber floor (Namur & Charlier, 2012).
In contrast, the density gradient that would develop at the chamber roof during evolution of the parental liquid may be unstable and cause compositional convection, bringing iron-rich liquids into contact with primitive phenocrysts in the mush layer at the chamber roof. The lower part of this roof mush layer of dense crystals and liquid may itself be gravitationally unstable above the clear primitive basaltic liquid in the chamber, allowing plumes of dense mush to descend into the open chamber (Brandeis & Jaupart, 1986; Marsh, 1988). The stability criteria for the mushy layer at the chamber roof may place constraints on the properties of descending crystal-rich plumes, perhaps accounting for the modest variation in the properties of the mushy end-member obtained from the mass-balance calculations. Although this simplified physical reasoning indicates that downwards motion of iron-rich residual liquid in the mush on the roof of a chamber, followed by descent of dense plumes of phenocrysts and ferrobasalt into the open basaltic chamber, may account for some key features of the observations, further fluid dynamical models of compositional convection and plume behaviour are required to test this conceptual model for the Laki system. Development of such models is beyond the scope of this study, but increasing interest in the behaviour of particle-laden fluids is leading to rapid advances in numerical modelling of problems in this field (Verhoeven & Schmalzl, 2009; Dufek & Bachmann, 2010).
Injection of crystal-bearing basalt into ferrobasalt: likelihood of occurrence?
The mechanisms for mush generation suggested above involve the development of the ferrobasaltic mush liquid by evolution and cooling in the mush layer itself. An alternative scenario is that the ferrobasalt was already present in a shallow melt body, which was then intruded by a crystal-bearing primitive basaltic liquid. The appeal of such a mechanism is that it can account for the lack of equilibrium between the observed crystal compositions and the calculated mush liquid composition. In this mechanism, the crystals are generated at depth, during the evolution of the primitive liquid, such that their rims may be close to equilibrium with this carrier liquid. Therefore, if the residence time of crystals in the mush liquid is short, there will be limited equilibration between the crystals and the mush liquid.
Eruptions of iron-rich basalts are well known to occur on Iceland, predominantly, but not exclusively, close to central volcanoes such as Krafla and Askja. Seismic and geodetic observations of these volcanoes have been interpreted in terms of a shallow magma chamber at 3–5 km depth (Brandsdóttir et al., 1997; Sturkell et al., 2006, 2008), consistent with available petrological estimates for the crystallization depth of the iron-rich basalts (Maclennan et al., 2001). The broad spatial correlation of ferrobasalts with shallow melt lenses, and the barometric coincidence of ferrobasalt equilibration depth with geophysical estimates of magma chamber depth are consistent with shallow storage of ferrobasalt in the Icelandic crust.
Porphyritic basalts are also commonly found in Iceland (Hansen & Grönvold, 2000), with some of the best-studied exemplars having been erupted through the Eastern Volcanic Zone (Halldórsson et al., 2008). The intrusion of a shallow ferrobasaltic chamber by rising porphyritic primitive basalt is therefore a plausible event in Icelandic volcanic systems, particularly in the EVZ. Evidence for injection of mafic basaltic melt into a more evolved ferrobasalt stored in a shallow melt lens is also provided by the pattern of compositions observed during the ad 1975–1984 fissure eruptions at Krafla in northern Iceland (Nicholson et al., 1991; Grönvold, 2006). The relationship between such an event and the production of the characteristics of the Laki whole-rock samples is therefore worthy of examination.
The compositional variation in the Laki whole-rock samples can be accounted for by mixing between a crystal-poor primitive carrier liquid and a liquid–crystal mush. The crystals in the mush are primitive phenocrysts, in equilibrium with melts more primitive than both the ferrobasaltic mush liquid and the calculated carrier liquid. Therefore, three components play a role in this mixing between mush and melt: crystals, mush liquid and carrier liquid. These three components are also available when porphyritic basalt intrudes a ferrobasaltic chamber. For this injection mechanism to account for the observations, however, there must be an effective transfer of the crystals from the incoming primitive basalt to the ferrobasaltic liquid. This transfer is controlled by fluid dynamical processes that occur following the injection of porphyritic basalt into the chamber.
The calculations of physical properties presented in Table 6 indicate that the incoming porphyritic magma, if it is hydrous and has a similar composition and phenocryst load to the mean erupted Laki magma, may be buoyant in a dry mush liquid. This ferrobasalt liquid may have been dehydrated by residence in a shallow magma chamber and perhaps via CO2-rich gas fluxing (Collins et al., 2009).
The fluid dynamics of the replenishment of chambers by light magma has been examined by Huppert et al. (1986). They found that the behaviour of the system was controlled by two Reynolds numbers and the chamber geometry. The Reynolds numbers are influenced by the density and viscosity of the fluids and the volumetric flux rate of magma into the chamber. Estimates of the upper and lower bounds on this flux rate can be obtained from the total magma volume of the eruption proposed by Thordarson & Self (1993), the duration of the eruption and the likely maximum residence time of the Laki magma in the crust as constrained by U-series disequilibrium measurements (Bindeman et al., 2006). The Reynolds numbers for low volume fluxes, when the chamber fills over hundreds of years, lie close to the upper limit of the laminar flow regime defined by Huppert et al. (1986) where the intruding magma rises through the resident magma in a conduit and ponds at the top of the chamber. The laminar flow regime involves negligible mixing between the intruding and resident magma during this upwards transit. In contrast, if the chamber fills in a year or less, the calculated Reynolds numbers place the flow within the turbulent regime, where the intruding magma rises as a turbulent plume, mixing extensively with the resident melt.
Injection of crystal-bearing basalt into ferrobasalt: crystal accumulation at layer boundary?
If the intruding porphyritic magma rises to form a layer at the top of the chamber, then crystal settling may occur if the phenocrysts or glomerocrystic clusters are denser than the carrier liquid. The mean settling rate of crystals is controlled by this density contrast and the viscosity of the host fluid, even in cases where Hazen settling occurs in a vigorously convecting chamber (Martin & Nokes, 1989; Burgisser et al., 2005). Therefore, a region of high crystal contents will develop at the boundary between the upper layer of low-viscosity, low-density carrier liquid and the lower layer of high-viscosity, high-density ferrobasalt liquid. This crystal-rich layer, with primitive phenocrysts in a ferrobasaltic melt, may have suitable properties to act as the mush end-member in the binary mixing between melt and mush required to match the Laki observations. This layer may be then partially disaggregated as the velocity field in the overlying liquid changes during eruption.
This mechanism of mush development at an interface between two liquid layers with contrasting physical properties has previously been proposed to account for observations from the Mariana Arc (Lee & Stern, 1998). The attraction of this mechanism is that it provides a means of transfer for the crystals from the primitive carrier liquid into the ferrobasaltic liquid. However, the principal drawback with this mechanism relates to the behaviour of plagioclase in the carrier liquid. The calculations presented in Table 6 show that plagioclase is less dense than the carrier liquid, so is likely to float rather than sink in the Laki melt. The observations indicate that no large-scale separation of plagioclase from the dense phases olivine and clinopyroxene has occurred. It is therefore unlikely that this density-driven accumulation of a mush layer is a suitable mechanism for reproducing the Laki observations.
Injection of crystal-bearing basalt into ferrobasalt: partitioning of crystals into viscous fluid?
The experimental study of Huppert et al. (1986) shows that if the intruding magma is injected rapidly then substantial mixing between the resident ferrobasalt and the incoming porphyritic basalt magma may occur. Understanding the transfer of crystals between the two liquids, with their differing physical properties, is a challenge that is beyond the scope of this study. Nevertheless, as the two liquids stir together, there is a possibility that the crystals will congregate within the regions of higher viscosity fluid. Furthermore, the response of particles, particle-rich regions and high-viscosity fluid to convective motions in the chamber may act to preferentially partition crystals and ferrobasalt into the same parts of the overall magmatic flow field. Further fluid dynamical experiments and modelling are therefore required to establish the potential ability of stirring of intruding porphyritic basalt and resident ferrobasalt to account for the Laki observations.
Constraints on the location of mush disaggregation
Comparison of the Laki tephra glass compositions with the experimental parameterization of Yang et al. (1996) indicates that these glasses were in equilibrium with olivine, clinopyroxene and plagioclase at pressures close to 0·2 GPa, equivalent to about 6 km depth. These estimates are subject to considerable uncertainty, with likely errors of 0·1 GPa or more. The barometric results indicate that the generation and disaggregation of the mush that controls the Laki whole-rock compositions occurred at depths of 10 km or less. It is important to note here that the data and models presented in this study do not further constrain the lateral positioning of this shallow melt lens with respect to the Laki fissures. The observations presented here cannot be used to discriminate between the lateral flow model where Laki eruptions are fed from a shallow chamber under Grímsvötn and models where the vertical flow from storage areas under Laki dominates. Accordingly, the shallow chamber that is referred to in the conceptual models presented above may be present either under Grímsvötn or under the Laki fissures. The lateral flow argument has been further discussed by Thordarson et al. (2003a).
Timescales of mush generation and disaggregation
The previous discussion has demonstrated that mush with the characteristics required to account for the observations from the Laki whole-rock samples can potentially be generated by compositional convection in a mushy layer at the roof of a chamber, or by mechanical partitioning of phenocrysts into high-viscosity fluid during flow in the interior of the chamber. To develop and test these conceptual models, fluid dynamical and laboratory experiments will be required. Additionally, powerful constraints on the nature of the processes operating to generate and disaggregate the mush may come from the study of intra-crystal compositional zonation. Modelling of diffusion patterns of suitable elements in Laki phenocrysts may provide information about the timescales of melt mixing and crystal transfer. This work is at present the focus of continuing research and will be the subject of future publications.
General application to porphyritic volcanic rocks
The methods for estimating mush properties described here can be applied to any porphyritic lava, and require only whole-rock compositions, estimates of the modal proportions of phenocrysts and estimates of the compositions of those phenocrysts. It is hoped that this method can be applied to lava samples from a wide range of settings to provide information about magmatic mushes and their entrainment into eruptions. The data required can be obtained at relatively low cost and effort, and the results make an important complement to those obtained from more intensive micro-analytical studies of mush development and disaggregation (Costa et al., 2010). FORTRAN code for application of the technique can be obtained from the authors upon request.
CONCLUSIONS
Whole-rock samples from the Laki lava flows are compositionally variable. High-precision XRF and ICP-MS analyses of samples from across the flow field confirm that statistically significant variations in major and trace element concentrations and ratios are present within the erupted products. Large signal-to-noise ratios, of greater than five, are observed for a selection of variably compatible and incompatible major and trace elements. Variation in trace element ratios, such as Zr/Y, is less well resolved and such ratios do not show signal-to-noise ratios of more than two. Strong linear correlations exist between major and trace element concentrations, such as TiO2 and Zr.
Petrographic observations indicate that the Laki samples are variably porphyritic, from under 5% phenocrysts in some tephra samples to over 30% phenocrysts in a few lava samples. Point-counting results indicate that the lava contains an average of 12 vol. % phenocrysts, with plagioclase, clinopyroxene and olivine present in relative proportions of 57:32:11. The major and trace element compositions of the whole-rock samples vary linearly with the total mass fraction of phenocrysts in the samples. Whole-rock samples with the lowest concentrations of incompatible trace elements have the highest proportion of phenocrysts. Surprisingly, this relationship does not arise from variable crystal accumulation into the phenocryst-free carrier liquid alone: simple models of accumulation fail to match the relationships between whole-rock composition and phenocryst content. Instead, the phenocrysts must have formed the solid part of a magmatic mush, with the mush liquid being more evolved than the carrier liquid. This mush was entrained into a crystal-poor carrier liquid prior to eruption. Whole-rock compositional variation is preserved because the mixing of the mush into the carrier liquid does not reach completion before eruption.
The geochemical consequences of progressive mixture between a crystal-poor carrier liquid and a liquid–crystal mush can be understood through a series of simple mass-balance expressions. Manipulation of these expressions allows for estimation of the mush liquid composition and mush porosity from the available whole-rock compositional and point-counting observations. Although there is a trade-off between estimates of mush liquid composition and mush porosity, independent constraints on mush liquid composition from phenocryst compositions were used to estimate an average mush porosity of 40–60%. The success of the binary mixing fits to whole-rock compositions indicates that the mean compositions of the mush and the carrier liquid cannot have changed substantially during the eruption. However, more detailed observations reveal that the mean mush content was higher during the later stages of the eruption, and that these high mush contents are related to the presence of primitive high Mg# olivine and clinopyroxene and anorthitic plagioclase primocrysts in the mush.
The available observations rule out the action of in situ crystallization of magma at the cooling margins of the chamber as a likely origin for the mush: the phenocrysts do not provide any compositional record of the crystallization interval required to generate the evolved mush liquid from the initial more primitive basalt. The juxtaposition of ferrobasaltic liquid with primitive phenocrysts required to form the mush may perhaps occur as a result of compositional convection at the chamber roof, or alternatively by the partitioning of phenocrysts into more viscous magma during the stirring of primitive basalt and ferrobasalt in the chamber. These physical and petrological speculations require further fluid dynamical investigation.
Many porphyritic basaltic eruptions may carry variable proportions of entrained, disaggregated mush. It is straightforward to apply the methods described here to other eruptions and it is hoped that the use of this technique can lead to future improvements in characterization of the properties of mushes in basaltic magma chambers.
FUNDING
This work was funded by a Natural Environment Research Council studentship NER/S/A/2004/12727 to E.P. at the University of Edinburgh.
ACKNOWLEDGEMENTS
The authors would like to thank David Neave, Olivier Namur, Madeleine Humphreys and Marie Edmonds for discussion of the work contained in this paper. Dennis Geist and two anonymous reviewers are thanked for careful and encouraging reviews, which substantially improved the paper. Marjorie Wilson is also thanked for wise editorial handling. Rob Ellam and the staff of SUERC are thanked for their assistance with the ICP-MS results, and Nic Odling for assistance with the XRF analyses at Edinburgh.
